Gulf of Maine Temperature Report: Spring 2026
Reports | Jul 9, 2026
Over the past decade, our scientists have led a body of research that highlights temperatures in the Gulf of Maine. To keep you informed, we share seasonal and annual updates about conditions in our region.
Read on for an inside look at what we've learned in our spring 2026 Gulf of Maine temperature report.
Overview
This report provides a seasonal update on sea surface temperature (SST), bottom temperature (BT), and upper-ocean thermal structure across the Gulf of Maine (GoM) during spring 2026 (March 1 – May 31). Building on the 2025 Gulf of Maine Temperature Report, this update examines spring temperature conditions, long-term warming trends, historical rankings, monthly evolution, and the seasonal development of thermal stratification using NOAA Optimum Interpolation Sea Surface Temperature (OISST) observations and the Glorys12v1 global ocean reanalysis.
Consistent with the 2025 annual report, all analyses are conducted using the GoM Ecological Production Unit (EPU), providing a geographically and ecologically representative definition of the GoM and ensuring direct comparability with the annual assessment.
Key Takeaways
- Spring 2026 was cooler than the exceptionally warm springs of recent years. Spring SST was 0.43°F below the long-term average, while spring bottom temperature ranked among the coolest observed since 1993, representing the coolest spring in more than two decades.
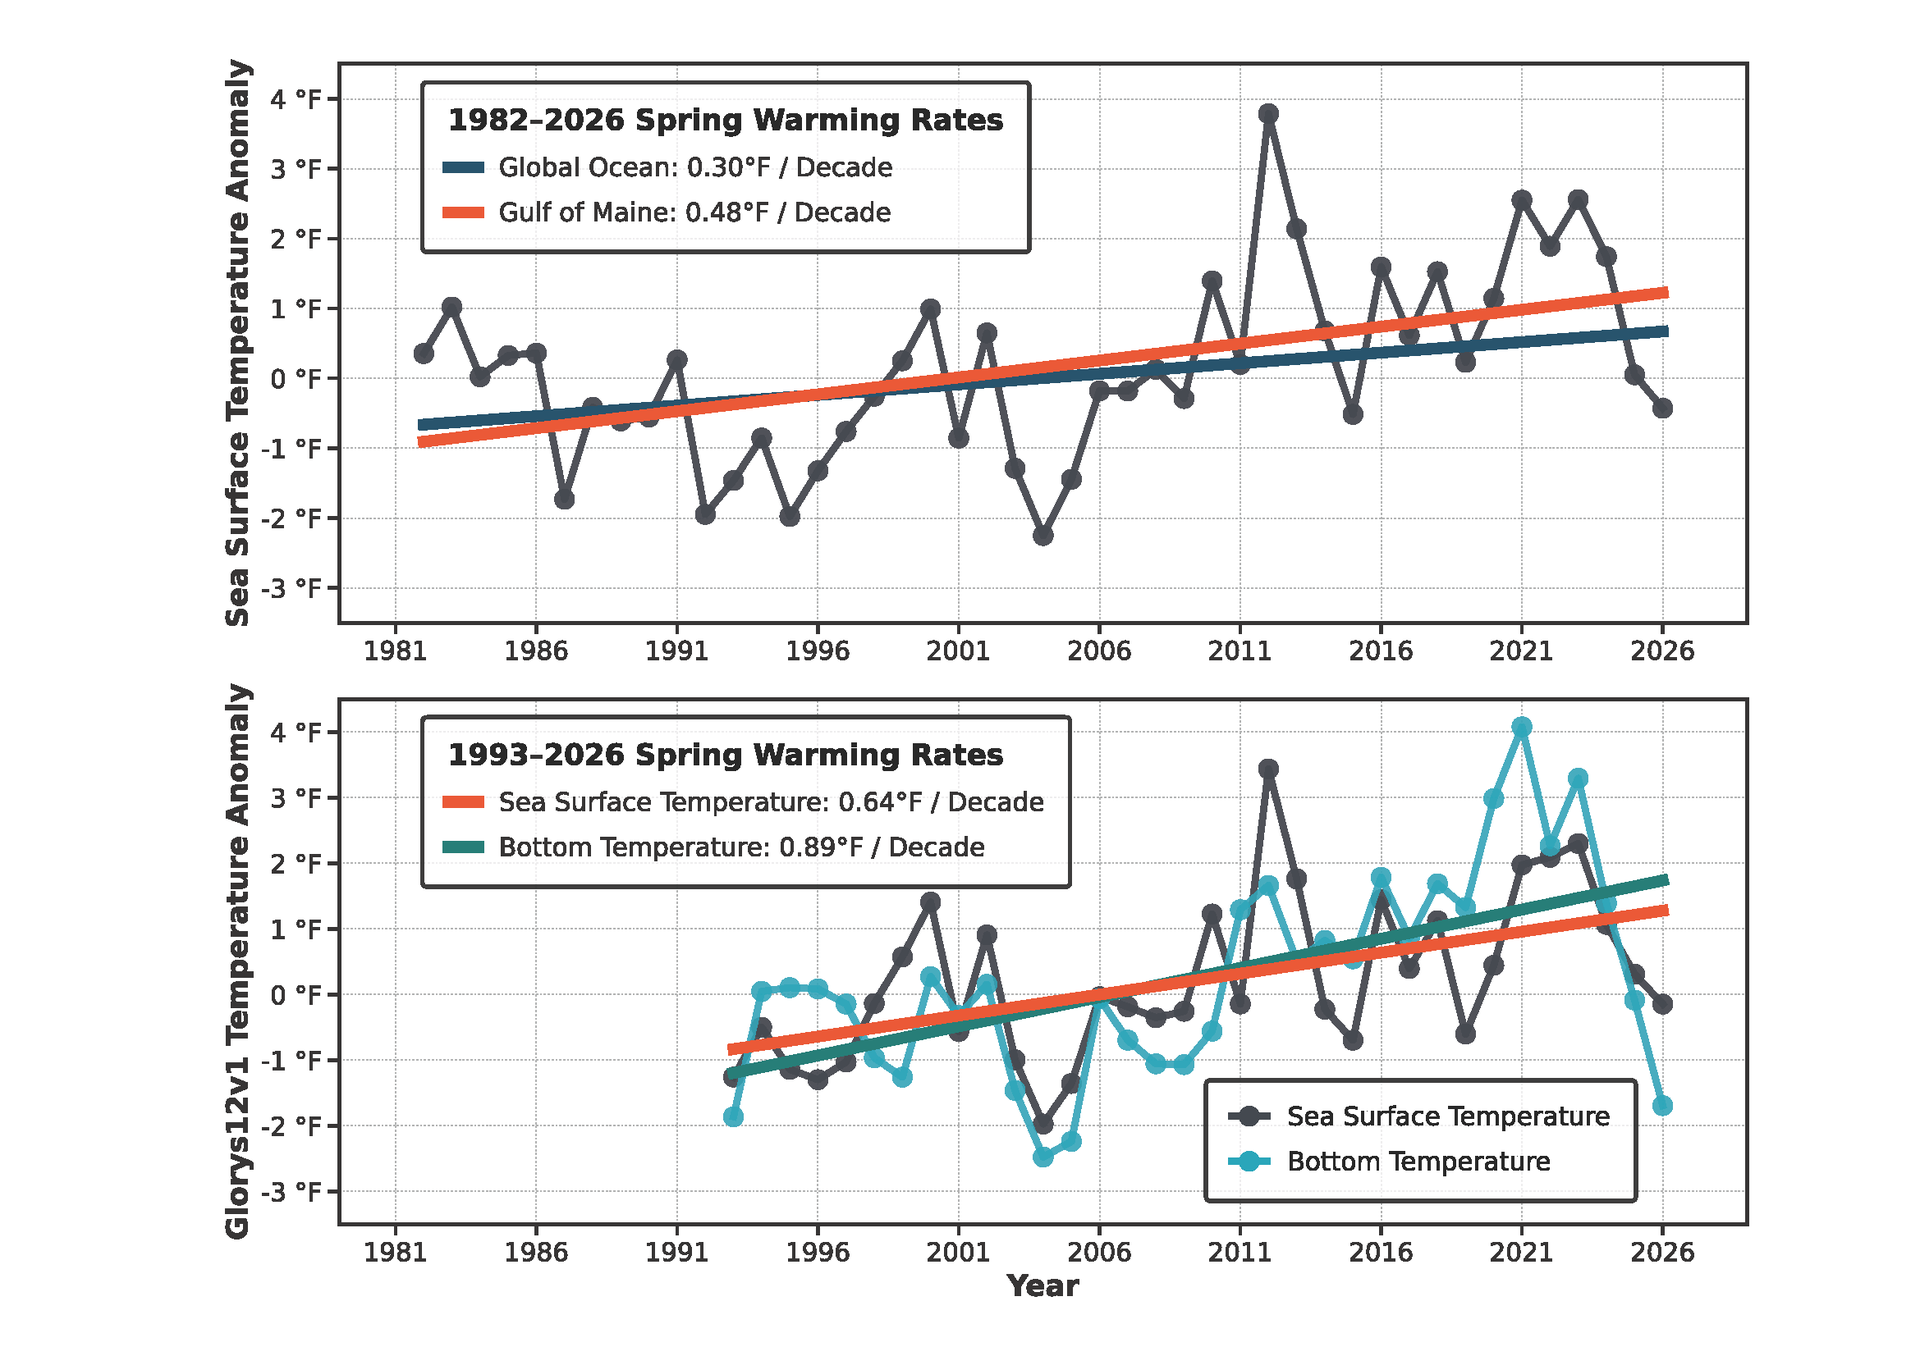
- Long-term spring warming continues across the GoM despite the cool conditions in 2026. Spring SST has warmed by 0.48°F per decade since 1982 based on the OISST, substantially faster than the global ocean (0.30°F per decade). Over the 1993 – 2026 period, Glorys12v1 indicates warming trends of 0.64°F per decade at the surface and 0.89°F per decade at the bottom.
- Surface and bottom waters evolved differently throughout the spring. Surface temperatures were cooler than average in March but gradually recovered toward near-normal conditions during April and May, whereas anomalously cool bottom waters persisted across much of the Gulf, producing multiple bottom cold spell events while no spring marine heatwaves were observed.
- Thermal stratification developed earlier than the climatological seasonal cycle. The regional mean surface-to-bottom temperature difference became persistently positive approximately two weeks earlier than average, while the mixed layer remained shallower than the climatological mean for about 82% of spring days, indicating an earlier establishment of spring stratification.
- Physical conditions influence the timing, distribution, and productivity of the Gulf of Maine ecosystem. Seasonal observations provide important context for interpreting biological and ecological changes documented in regional ecosystem assessments.
Spring temperature conditions
Spring SSTs in the GoM have continued their long-term warming trend (Figure 1a). Based on the NOAA OISST record (1982 – 2026), spring SST has warmed at a rate of 0.48°F per decade, substantially faster than the global ocean average (0.30°F per decade), reinforcing the GoM’s status as one of the fastest-warming marine ecosystems. The Glorys12v1 reanalysis also captures the pronounced long-term spring warming observed in NOAA OISST (Figure 1b), although the estimated spring SST warming rate over the common 1993 – 2026 period is lower (0.64°F per decade) than that derived from NOAA OISST over the 1982 – 2026 period (0.86°F per decade).
Spring 2026 SST was cooler than most springs observed during the past decade and marked a departure from the exceptionally warm conditions that prevailed between 2020 and 2024. Nevertheless, spring SST remained well above the coldest conditions recorded during the 1990s and early 2000s, illustrating that considerable year-to-year variability continues to occur within a long-term warming climate.
Spring BT in the GoM has warmed even more rapidly than SST, increasing at a rate of 0.89°F per decade since 1993, compared with 0.64°F per decade for spring SST in the Glorys12v1 reanalysis. BTs also exhibit larger interannual variability, with exceptionally warm conditions during the early 2020s followed by a sharp cooling in spring 2026. The spring 2026 BT anomaly was the coolest since 2005, marking the largest negative spring BT anomaly observed in the past two decades despite the persistent long-term warming trend. Because bottom temperatures reflect changes in shelf water masses and subsurface heat storage, they provide important information beyond surface warming alone and influence the seasonal evolution of upper-ocean stratification and benthic habitats in the GoM.
How did spring 2026 compare to historical record?
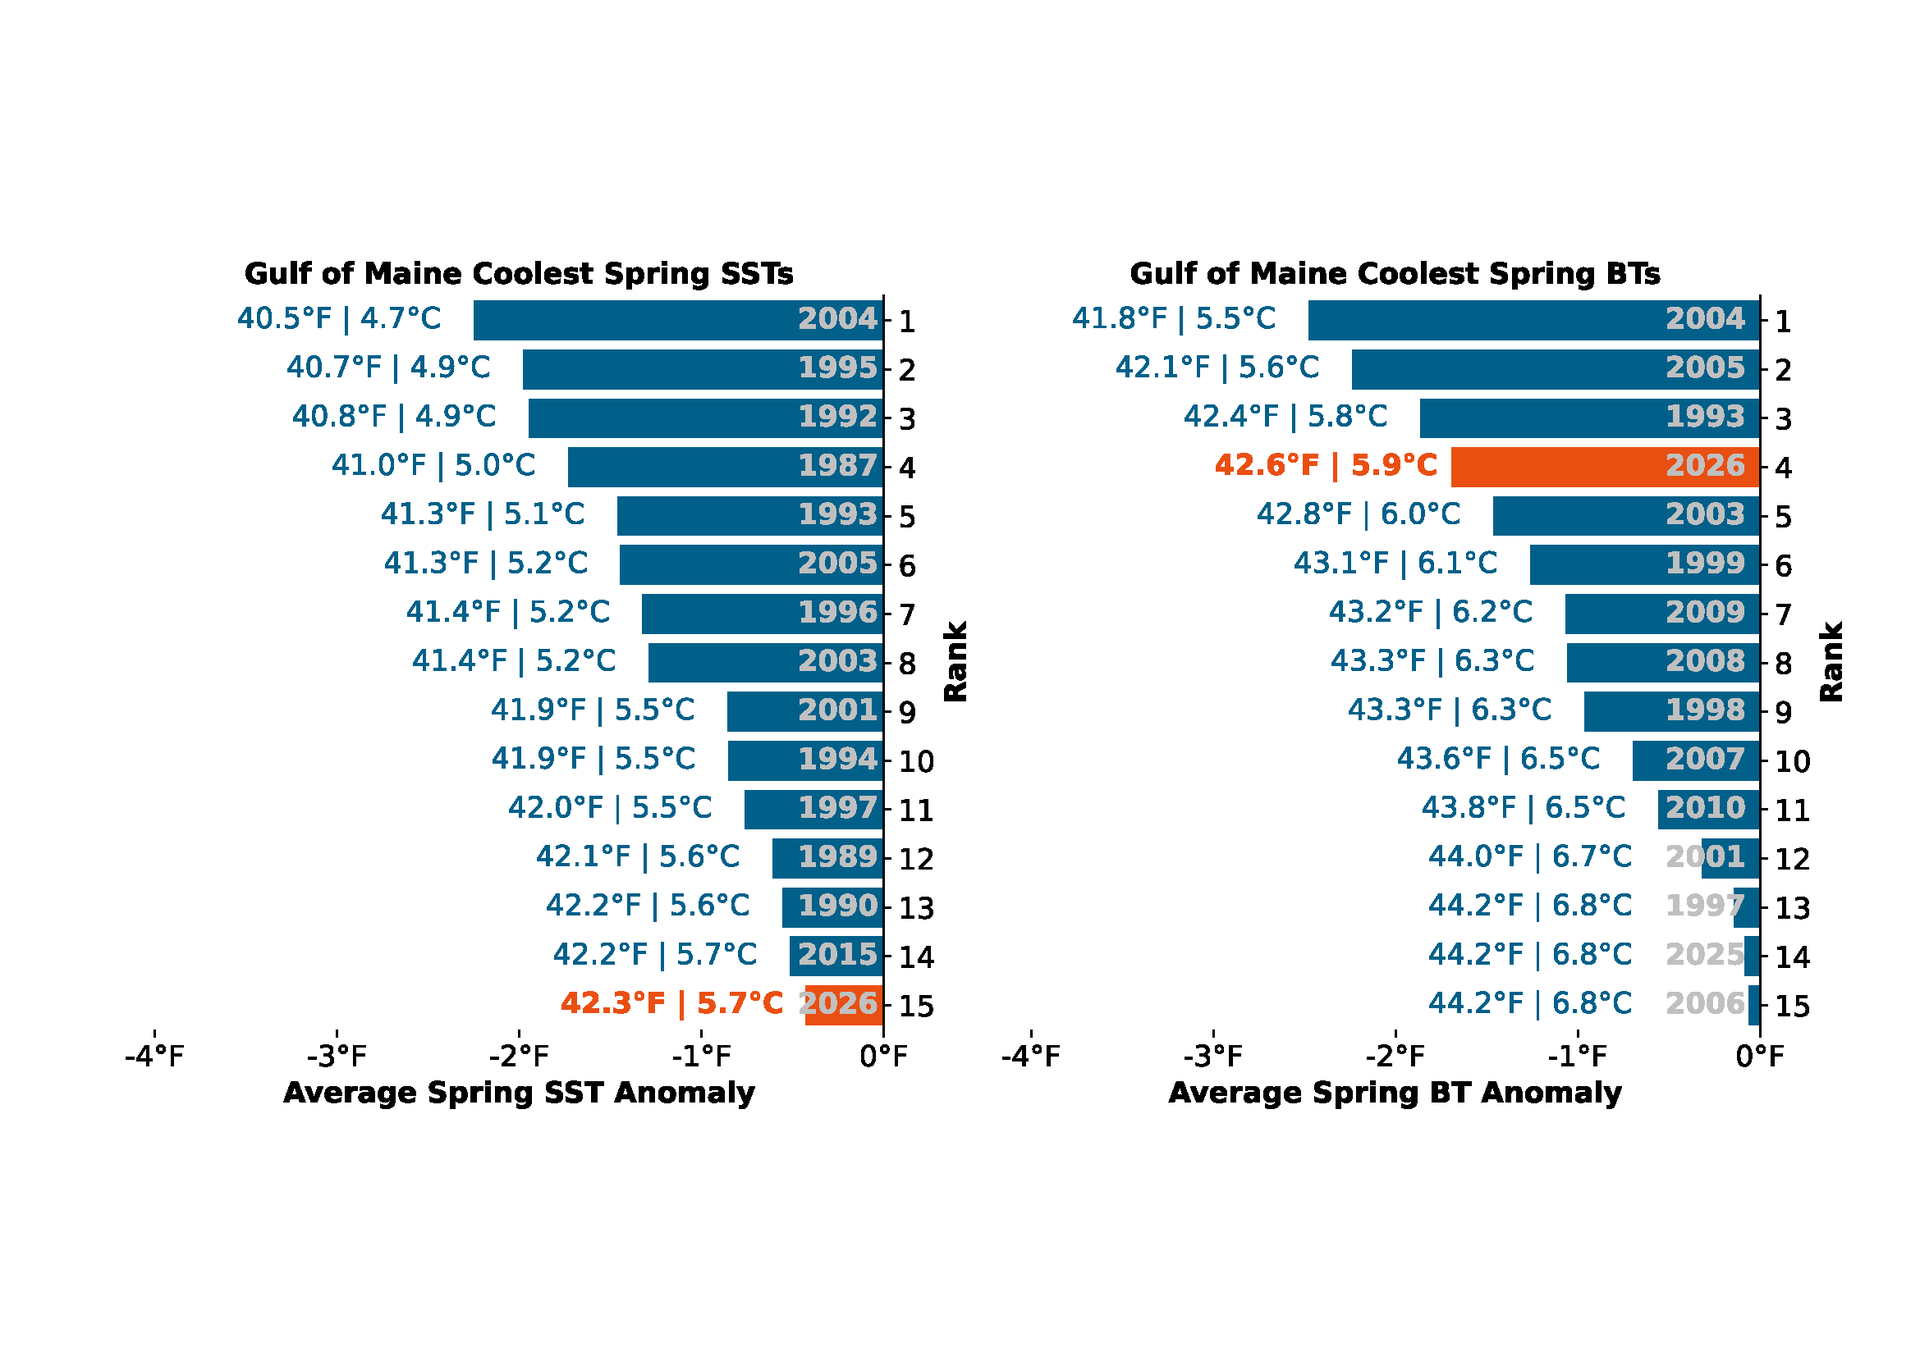
To place spring 2026 into historical context, Figure 2 ranks the coolest spring SST and BT years in the GoM based on seasonal averages. Although spring 2026 was cooler than most recent years, it was not among the coldest spring SSTs on record. With an average spring SST of 42.3°F and about 0.43°F below the 1991 – 2020 climatology, spring 2026 ranked as the 15th coolest spring since 1982, indicating that substantially colder surface conditions occurred during the late 1980s, 1990s, and early 2000s.
In contrast, BTs were much more unusual. Spring 2026 recorded an average BT of 42.6°F, 1.69°F below the 1991 – 2020 climatology, ranking as the fourth coolest spring since 1993. Only 2004, 2005, and 1993 exhibited colder spring BTs, making 2026 the coolest spring bottom conditions observed in more than two decades. This contrast between SST and BT highlights that spring 2026 cooling was considerably more pronounced at depth than at the ocean surface.
Spatial patterns of spring 2026 temperature anomalies and long-term trends
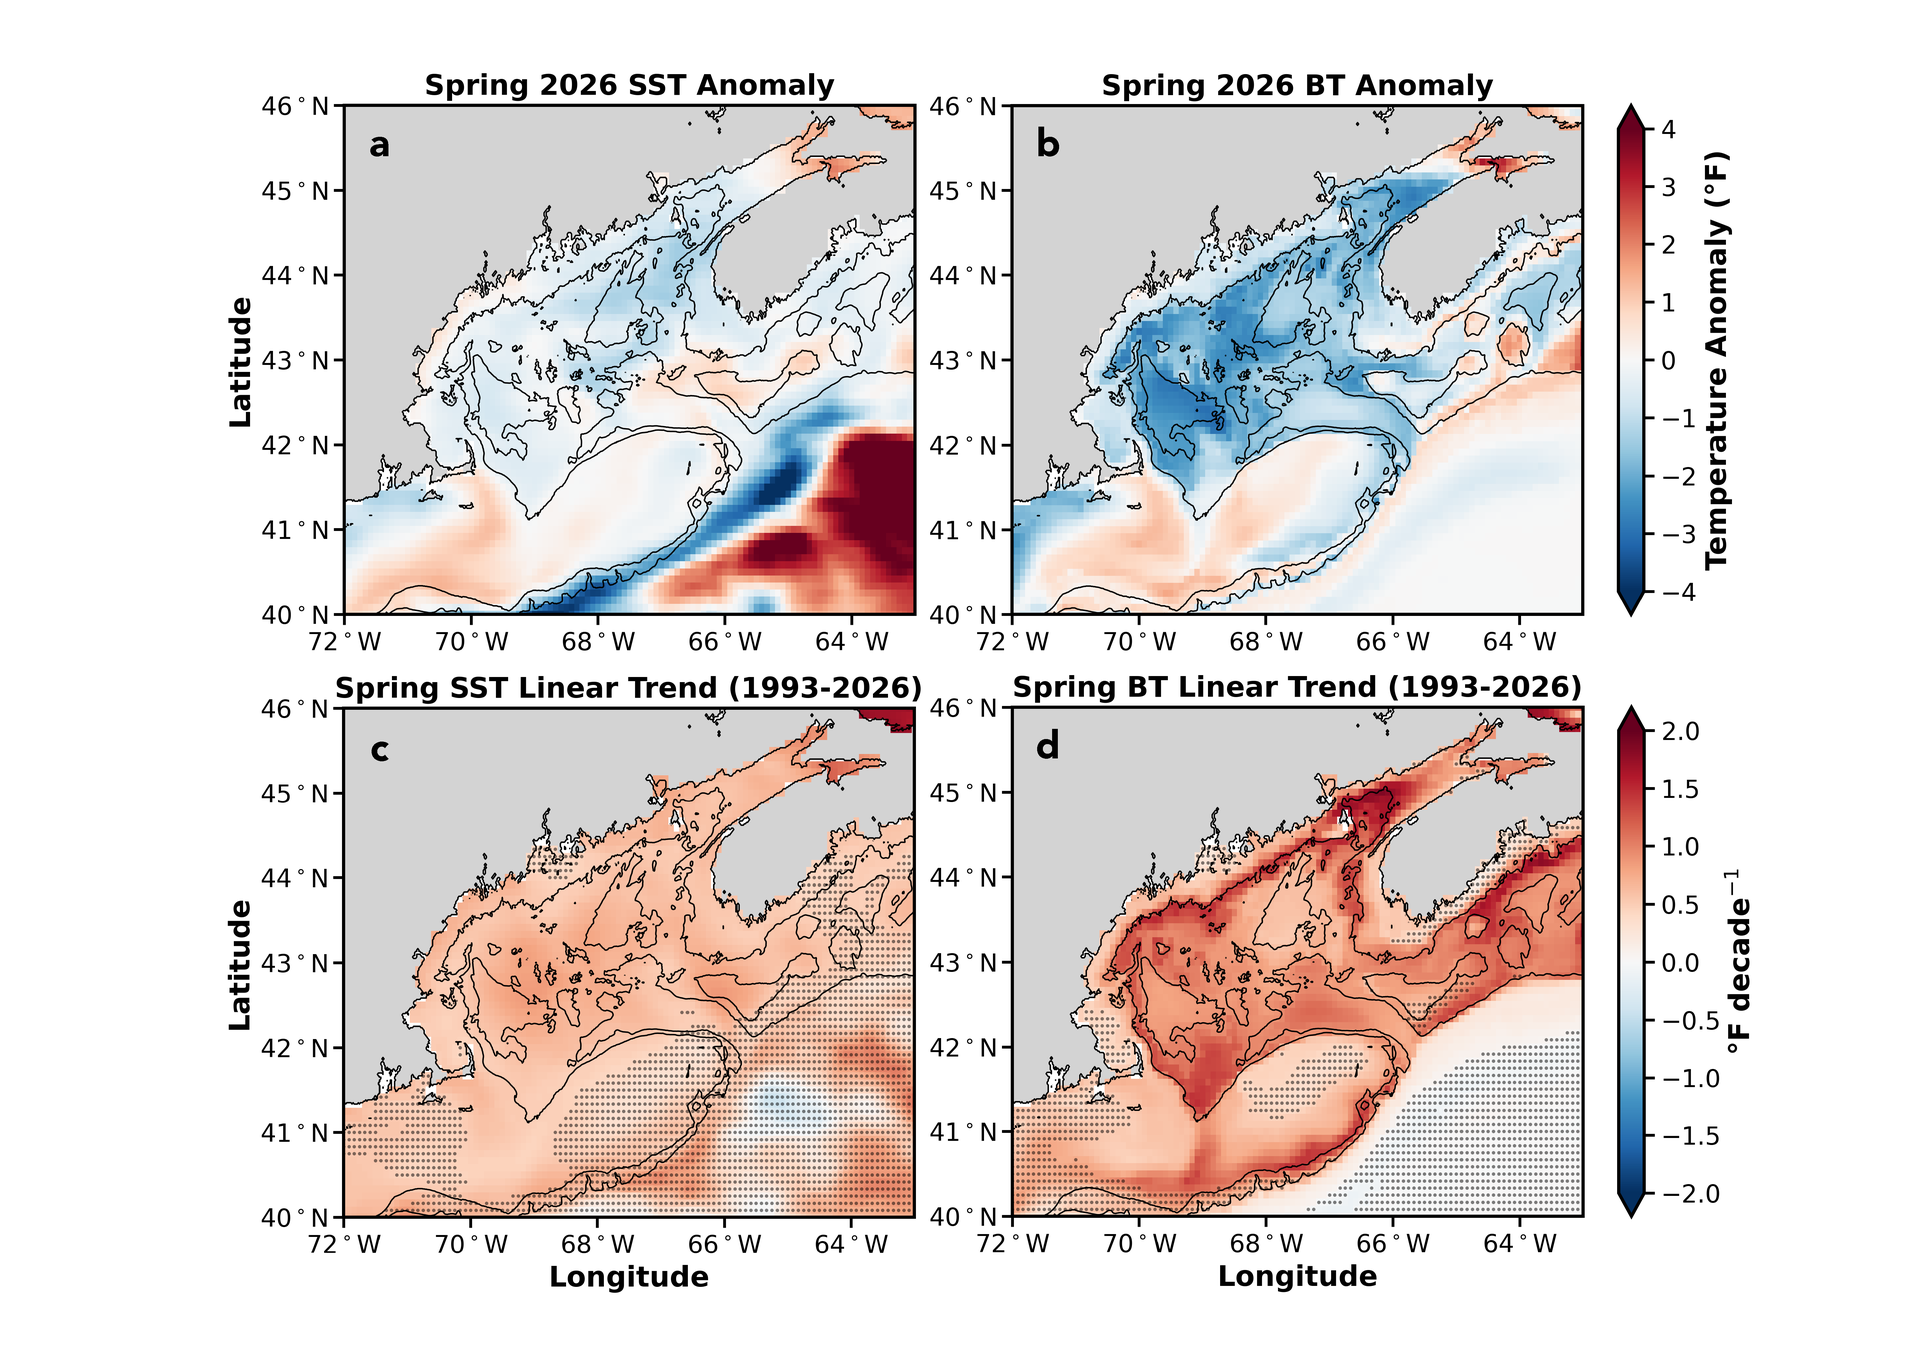
Spring 2026 exhibited substantial spatial variability in both SST and BT across the GoM (Figure 3). Surface temperatures were generally near or below the climatological (long-term) mean over much of the Gulf, with the strongest negative SST anomalies occurring in the central and eastern GoM. In contrast, relatively weak positive SST anomalies were present in portions of the western Gulf and along the shelf break.
Bottom temperature anomalies displayed a distinctly different spatial pattern from SST. Negative BT anomalies were more widespread and generally larger in magnitude than those at the surface, indicating that spring 2026 cooling was more pronounced at depth. The strongest bottom cooling occurred over the central and western GoM, consistent with the unusually cool spring bottom temperatures identified in Figures 1 and 2.
Despite the relatively cool conditions observed in spring 2026, long-term warming trends remain evident throughout the GoM. Spring SST has increased across most of the region since 1993, with the strongest warming occurring in coastal regions and the central GoM. Spring bottom temperatures exhibit generally stronger warming trends than SST across much of the Gulf, with particularly strong warming along the 100-m depth contour. These contrasting spatial patterns suggest that long-term warming has not been vertically uniform across the GoM.
Daily temperature variability and cold spells in the Spring
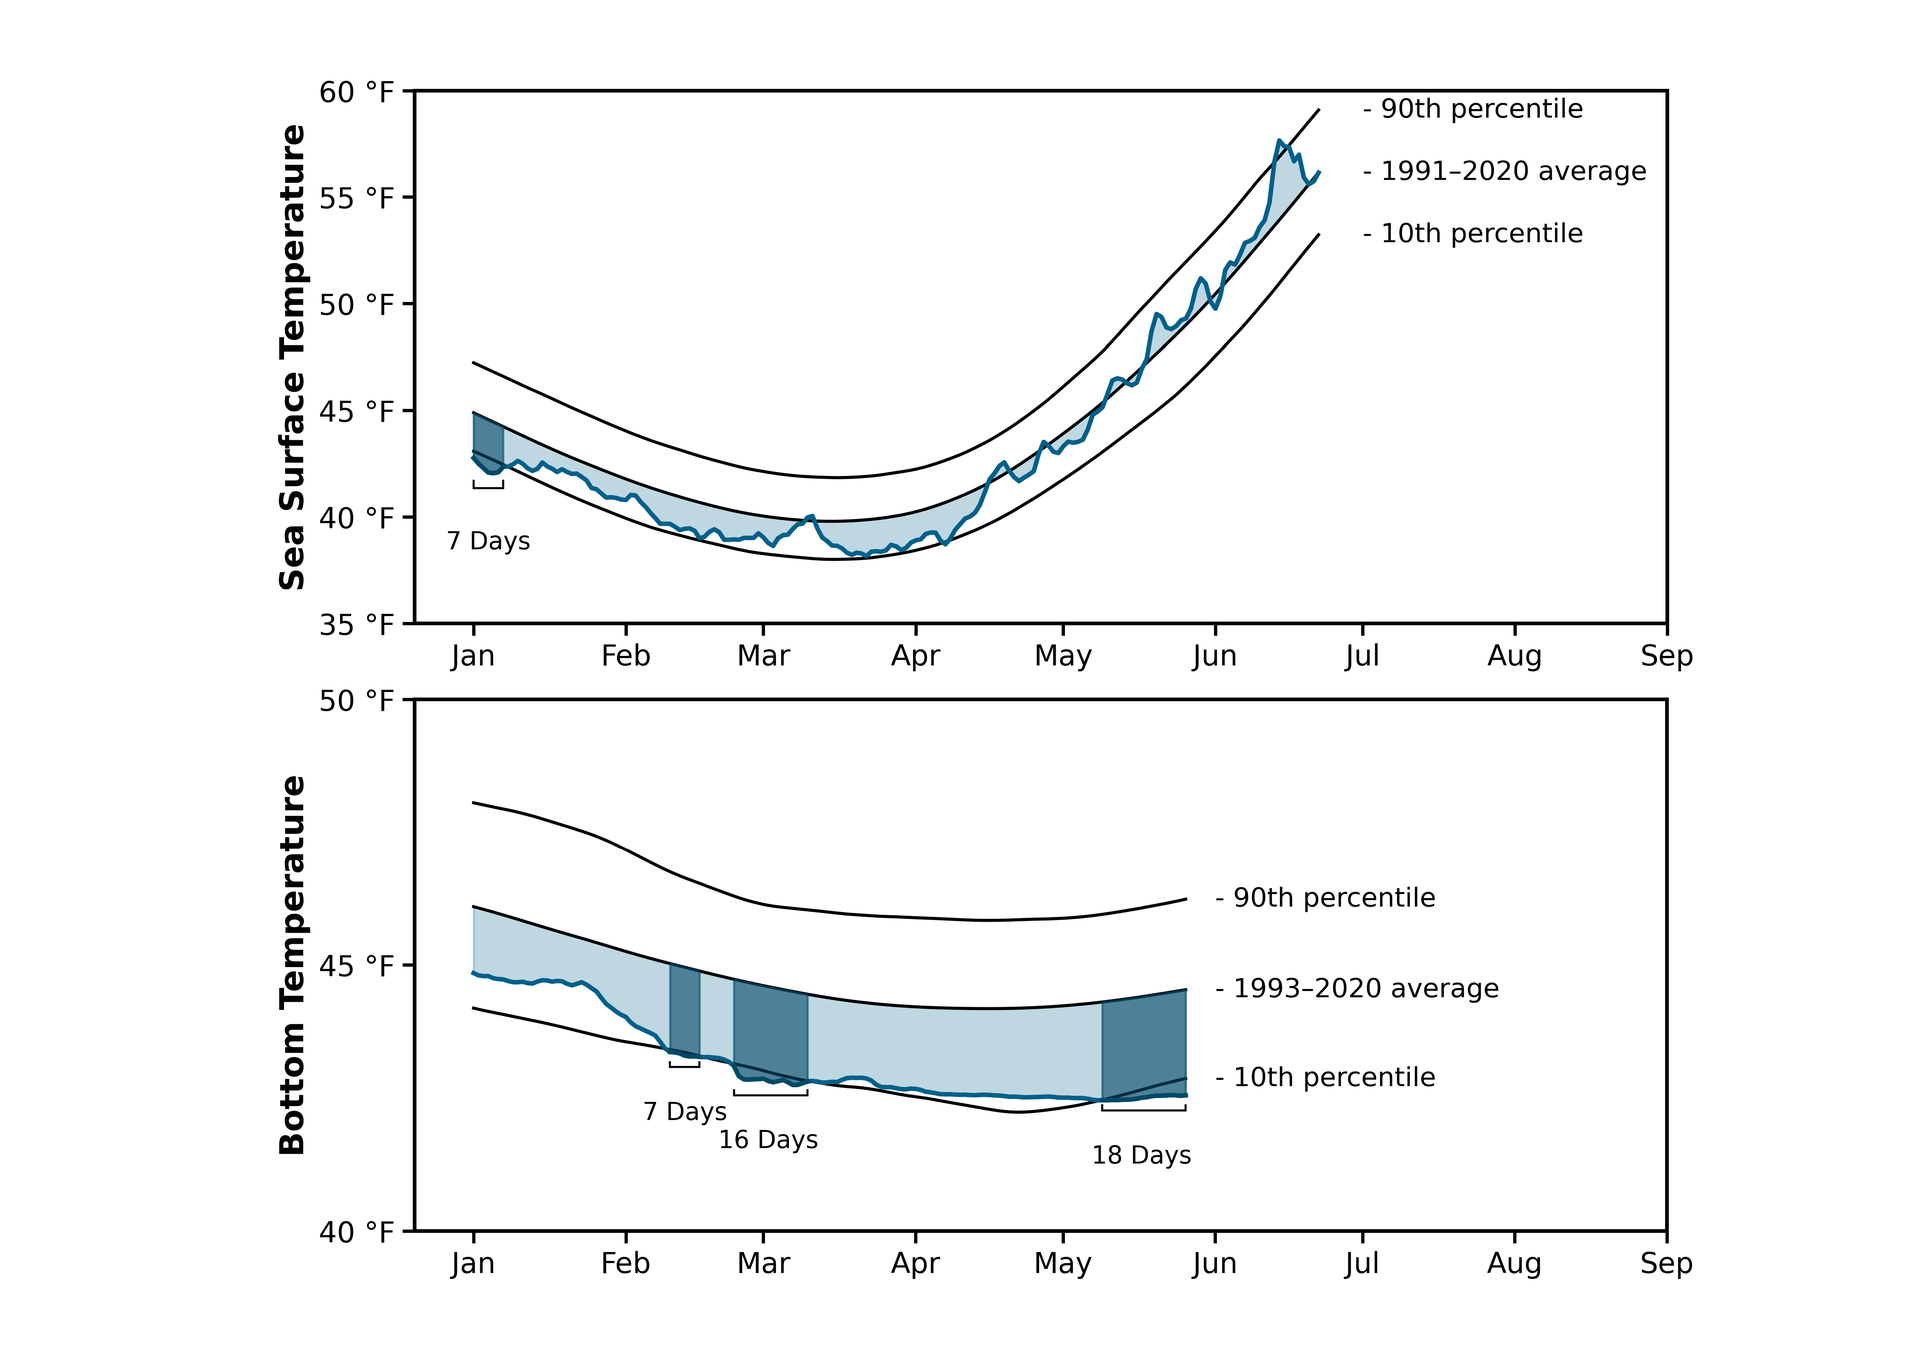
Daily SST and BT time series provide additional context for the seasonal evolution of spring 2026 conditions in the GoM (Figure 4). Surface temperatures generally followed the climatological seasonal cycle but remained below the long-term mean through much of the spring. Surface warming then accelerated during late April and May, and SST remained within the climatological range for the remainder of the spring.
Bottom temperatures exhibited a markedly different seasonal evolution. BT remained below the climatological mean for the entire spring and experienced multiple periods below the 10th percentile threshold. Two bottom cold spell events were identified during spring 2026, lasting 16 and 18 days, respectively. These prolonged bottom cold spells indicate that anomalously cool conditions persisted much longer at depth than at the surface, consistent with the widespread negative bottom temperature anomalies shown in Figure 3 and the historically cool spring bottom temperatures highlighted in Figures 1 and 2.
The contrasting seasonal evolution of SST and BT demonstrates that spring warming progressed more rapidly at the surface than at the bottom. While surface waters transitioned toward near-normal conditions by late spring, bottom waters remained anomalously cool, suggesting a delayed seasonal warming of deeper shelf waters during 2026.
Spring thermal stratification development
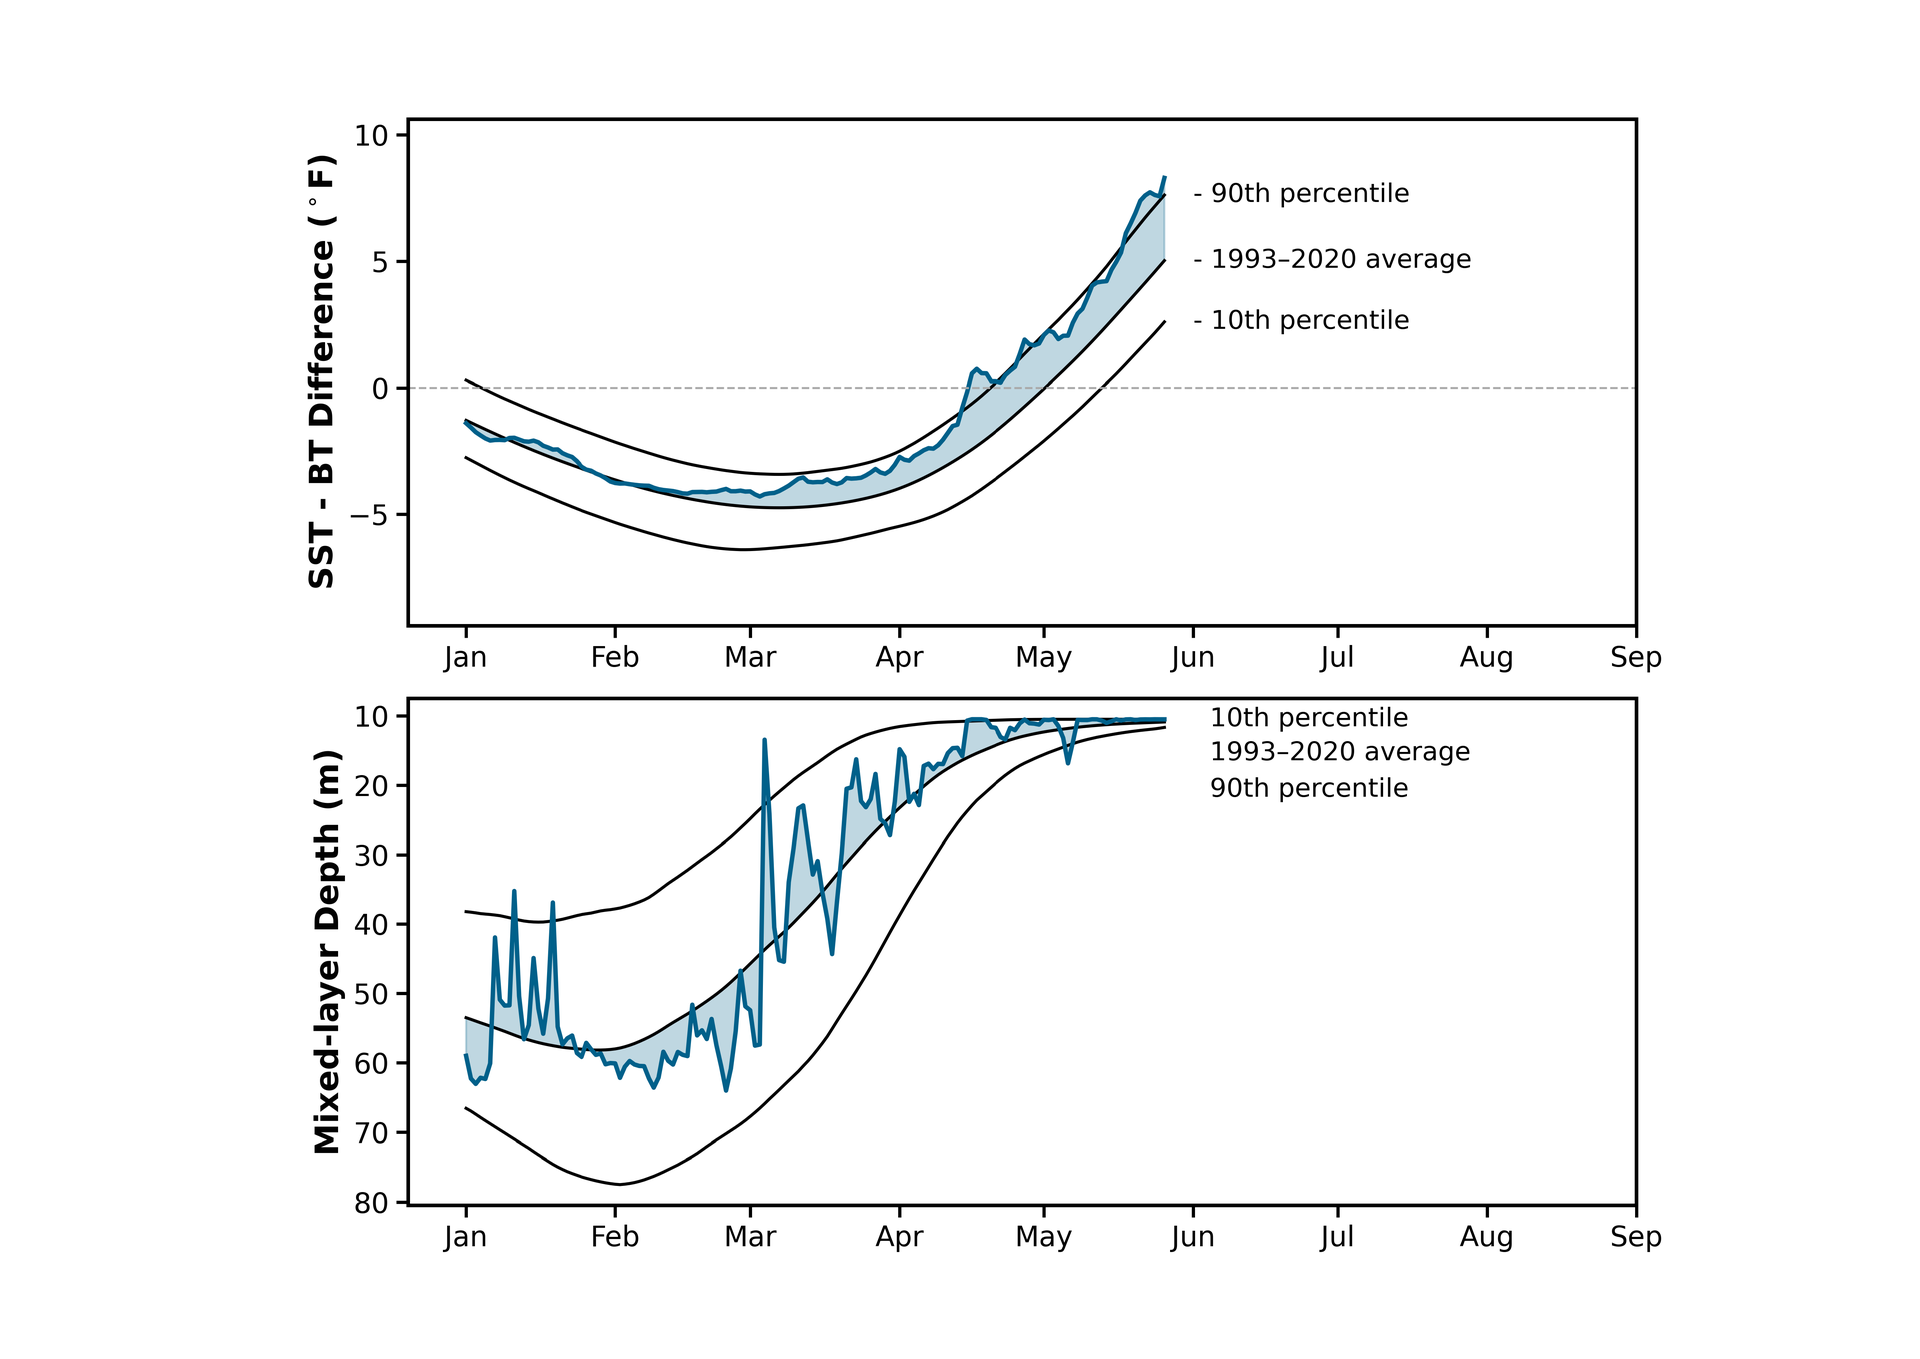
As surface waters warm each spring, they become increasingly separated from the cooler waters below, forming a thermally stratified water column. The timing of this seasonal transition influences vertical mixing, nutrient availability, and marine habitat conditions throughout the Gulf of Maine. The seasonal development of thermal stratification during spring 2026 is illustrated using two complementary indicators: the surface-to-bottom temperature difference (SST – BT) and mixed-layer depth (MLD) (Figure 5). During winter and early spring, SST – BT remained negative, indicating that surface waters were generally cooler than bottom waters. Beginning in April, surface waters warmed relative to the bottom, leading to a rapid increase in the surface-to-bottom temperature difference through the remainder of spring. Beginning in mid-April, the regional mean SST – BT difference became persistently positive and exceeded the climatological mean, indicating that thermal stratification developed approximately two weeks earlier than the climatological seasonal cycle. By late April, the SST – BT difference approached the 90th percentile and remained above the climatological mean throughout the remainder of spring, indicating stronger-than-average thermal stratification during late spring.
The evolution of MLD provides an independent view of this seasonal transition. Mixed layers remained relatively deep through winter before becoming progressively shallower during spring as surface heating intensified. Although the regional mean MLD exhibited considerable day-to-day variability, particularly during March, the overall seasonal evolution closely followed the increase in SST – BT. Throughout most of the spring, the regional mean MLD remained shallower than the climatological mean, indicating that the seasonal transition toward a shallow mixed layer occurred earlier than average. By late spring, the mixed layer had become shallower, reaching approximately 10 m, consistent with the establishment of a shallow, thermally stratified surface layer across much of the GoM.
Together, these results suggest that the persistence of anomalously cool bottom temperatures delayed the seasonal warming of deeper waters, while surface waters responded more rapidly to increasing spring insolation. The resulting enhancement of the surface-bottom temperature gradient promoted earlier-than-average thermal stratification, as evidenced by both the increasing SST–BT difference and the earlier decrease in depth of the mixed layer, suggesting that persistence of anomalously cool bottom waters likely contributed to the earlier establishment of spring thermal stratification. Although not evaluated in this report, earlier thermal stratification may also alter the seasonal timing of vertical mixing and nutrient transport, with potential downstream effects on primary productivity and ecosystem dynamics in the GoM.
Monthly progression in Spring temperature anomalies
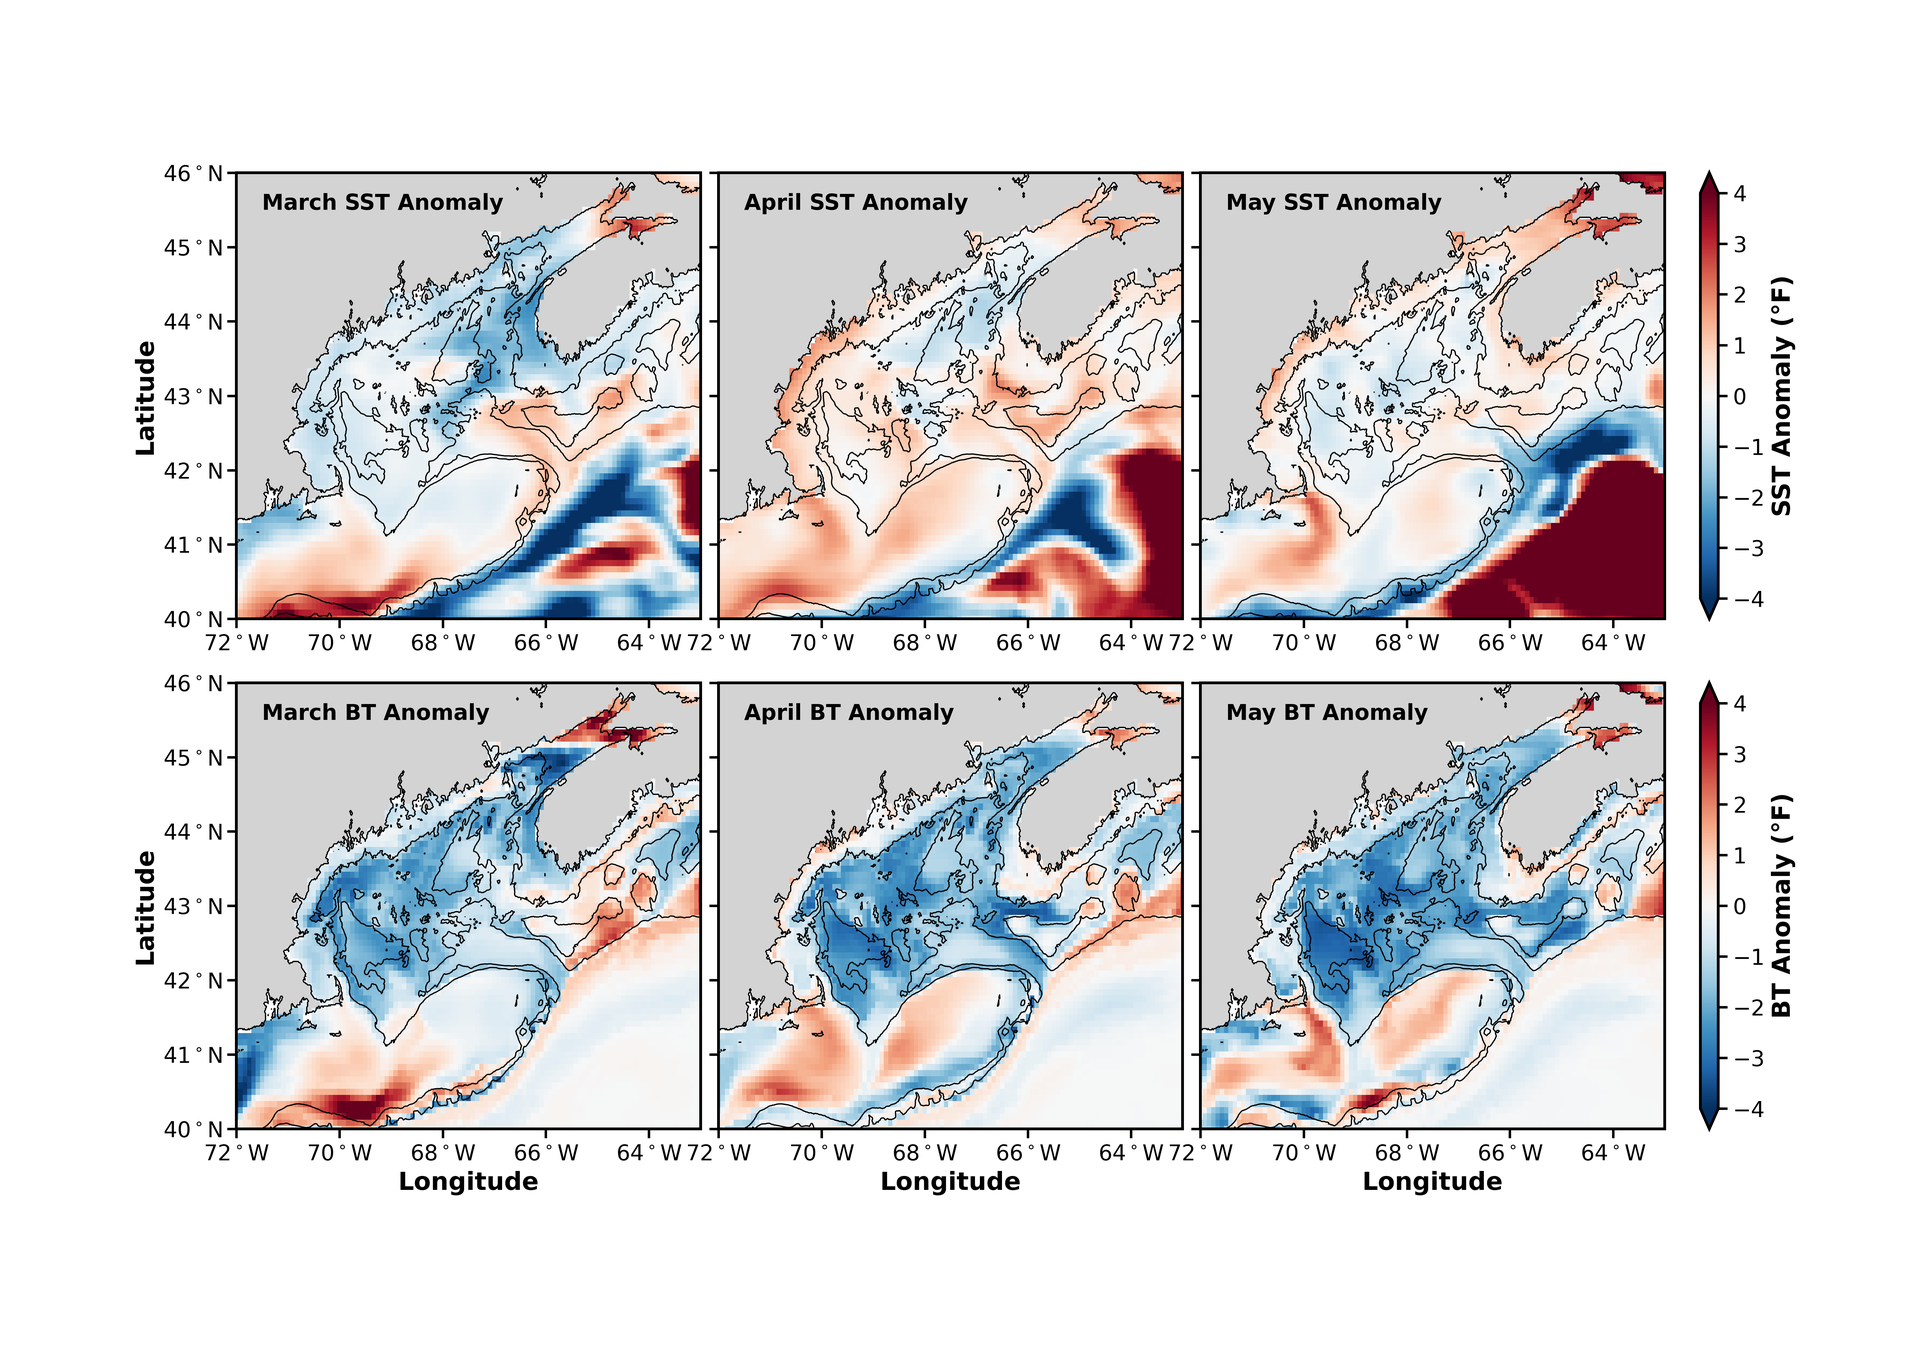
Monthly temperature anomaly maps reveal the evolution of spring 2026 conditions across the GoM (Figure 6). In March, SST anomalies were predominantly negative over the central and eastern Gulf. During April, surface warming expanded across the western Gulf and northeastern coastal regions, although cool SST anomalies persisted over portions of the central Gulf. By May, warm anomalies became increasingly pronounced in offshore waters associated with the Gulf Stream, while weak negative SST anomalies remained over much of the Gulf interior. Bottom temperature anomalies exhibited a markedly different seasonal evolution. Unlike SST, negative BT anomalies remained widespread throughout spring, with anomalously cool bottom waters persisting across much of the Gulf interior throughout the spring.
Overall, surface waters gradually transitioned toward near-normal or locally above-normal conditions during April and May, whereas bottom waters remained anomalously cool across much of the Gulf throughout the spring. This persistent vertical contrast is consistent with the earlier development of thermal stratification described in Figure 5 and suggests that the persistence of anomalously cool bottom waters played an important role in enhancing the surface-bottom temperature contrast and shaping the spring 2026 thermal structure of the GoM.
Data sources, methods, and reproductivity
This report integrates satellite observations and global ocean reanalysis products to characterize spring SST, BT, MLD, and thermal stratification variability in the GoM. All analyses presented in this report are fully reproducible using publicly available datasets and transparent methods described below.
Data Sources
NOAA OISST v2 (Optimum Interpolation Sea Surface Temperature)
We use the NOAA OISST v2 daily dataset (0.25° spatial resolution), available from 1982 to present, to calculate sea surface temperature (SST) anomalies, long-term trends, seasonal cycles, and marine heatwave and cold spell statistics. OISST provides a consistent multi-decadal record suitable for long-term trend analysis and allows direct comparison with prior GMRI warming reports.
GLORYS12v1 Ocean Reanalysis
To improve spatial detail and extend the analysis to subsurface conditions, we use the GLORYS12v1 global ocean reanalysis (1/12° horizontal resolution, 50 vertical levels) from 1993 onward (the satellite altimetry era). GLORYS12v1 assimilates satellite and in situ observations into a dynamical ocean model, providing three-dimensional temperature fields. Except surface and bottom temperatures, density-defined MLD was also obtained from this reanalysis for spring thermal stratification analysis.
Climatology and Baseline Periods
Temperature anomalies are calculated relative to fixed baseline climatologies: 1991 – 2020 for NOAA OISST (to maintain consistency with previous GMRI warming reports and other NOAA climate assessments); 1993 – 2020 for GLORYS12v1 (to ensure internal consistency within the altimetry-era reanalysis record). Daily climatologies were constructed using a smoothed seasonal cycle derived from multi-year daily means, ensuring comparability with marine heatwave detection thresholds.
Marine Heatwave and Cold Spell Definition
Marine heatwave and cold spell events were identified following the framework of Hobday et al. (2016) and Oliver et al. (2018). Events were defined as periods during which daily SST: exceeded the smoothed 90th percentile (MHW) or fell below the smoothed 10th percentile (cold spell), for at least five consecutive days. Gaps of up to two days below (or above) the threshold were merged into a single event. Event characteristics, including start date, end date, duration, and peak intensity, were derived directly from the daily SST time series. Bottom temperature events were evaluated using the same percentile-based framework, applied to GLORYS-derived bottom temperature time series.
Regional Delineation
The GoM domain used in this report is identical to that adopted in the 2025 Gulf of Maine Temperature Report. All analyses are based on the GoM Ecological Production Unit (EPU), replacing the rectangular study domain used in earlier GMRI warming reports. Using a consistent EPU-based domain ensures direct comparability with the 2025 annual report while providing a geographically and ecologically representative definition of the GoM.
Reproducibility
All datasets used in this report are publicly available. Analyses were conducted using standard statistical methods for anomaly calculation, linear trend estimation, percentile threshold detection, and spatial averaging. The use of fixed climatological baselines ensures consistency across figures and comparability with prior GMRI warming assessments.
Recommended Citation
If you would like to cite this report, please use:
Gulf of Maine Research Institute. 2026. Gulf of Maine Warming Update: Spring 2026 https://gmri.org/stories/gulf-of-maine-warming-update-spring-2026
Author Contributions
The report was led and written by Dr. Zhuomin (Jasmine) Chen.
Acknowledgements
The author thanks Dr. Janet Duffy-Anderson and Dr. Katie Giannakopoulos for their thoughtful review and constructive comments on the draft report.