Gulf of Maine Warming Update: Summer 2025
Reports | Oct 14, 2025
Over the past decade, scientists have led a body of research that highlights the rapid pace of warming in the Gulf of Maine. To help keep you informed, we share seasonal and annual updates about conditions in the Gulf of Maine.
Read on for an inside look at what we've learned in our summer 2025 Gulf of Maine warming update.
For this seasonal report we present an analysis of sea surface temperature (SST) for summer 2025, defined as the period extending from June 1, 2025 through August 31, 2025.
Summertime in the Gulf of Maine is a dynamic time of year for marine life and ocean enthusiasts alike. During the summer months, Gulf of Maine SST approaches its annual high, and the foraging opportunities for marine life hit their yearly peaks. The abundance of zooplankton surges in the summer in response to spring phytoplankton blooms they feed upon. Many species migrate into the Gulf of Maine to capitalize on this bounty of food. For example, Atlantic bluefin tuna and various whales migrate hundreds of miles for a once-a-year feeding opportunity. For year-round resident species, summer can be a period of stress, as this is when SST is most likely to approach or exceed suitable temperature ranges. For other species, these same warmer summer temperatures open the door to seasonal travel into the area.
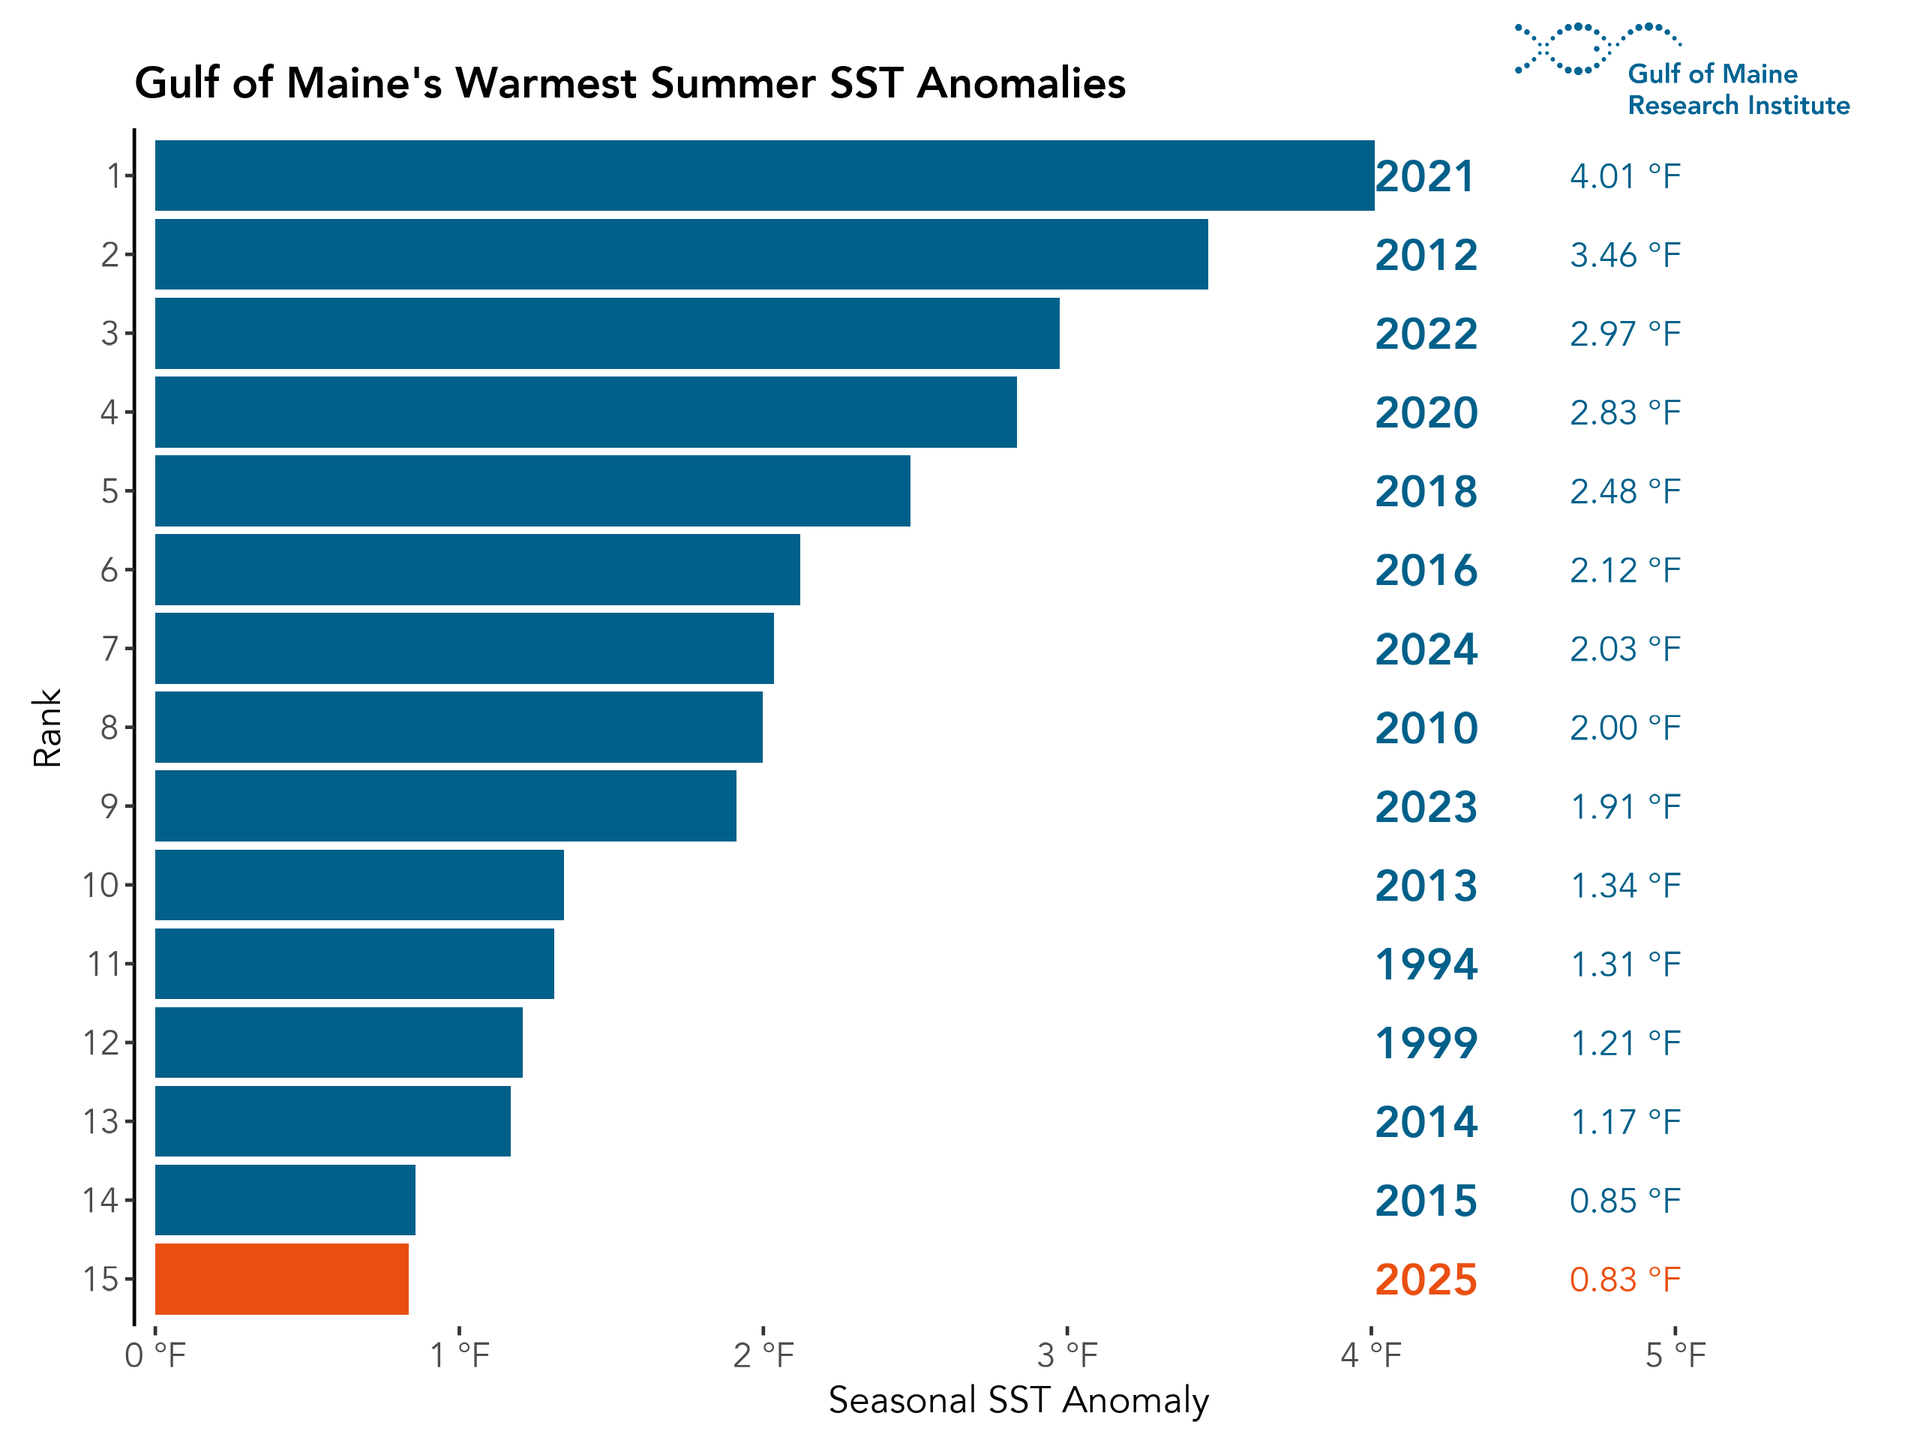
This year, the average summer SST for the Gulf of Maine was 59.94°F. This seasonal average temperature was 0.83°F above the 1991 – 2020 climatological reference period (CRP) summer average of 59.11°F, ranking as the 15th warmest (30th coldest) summer on record (extending 44 years since satellite observations began in the fall of 1981).
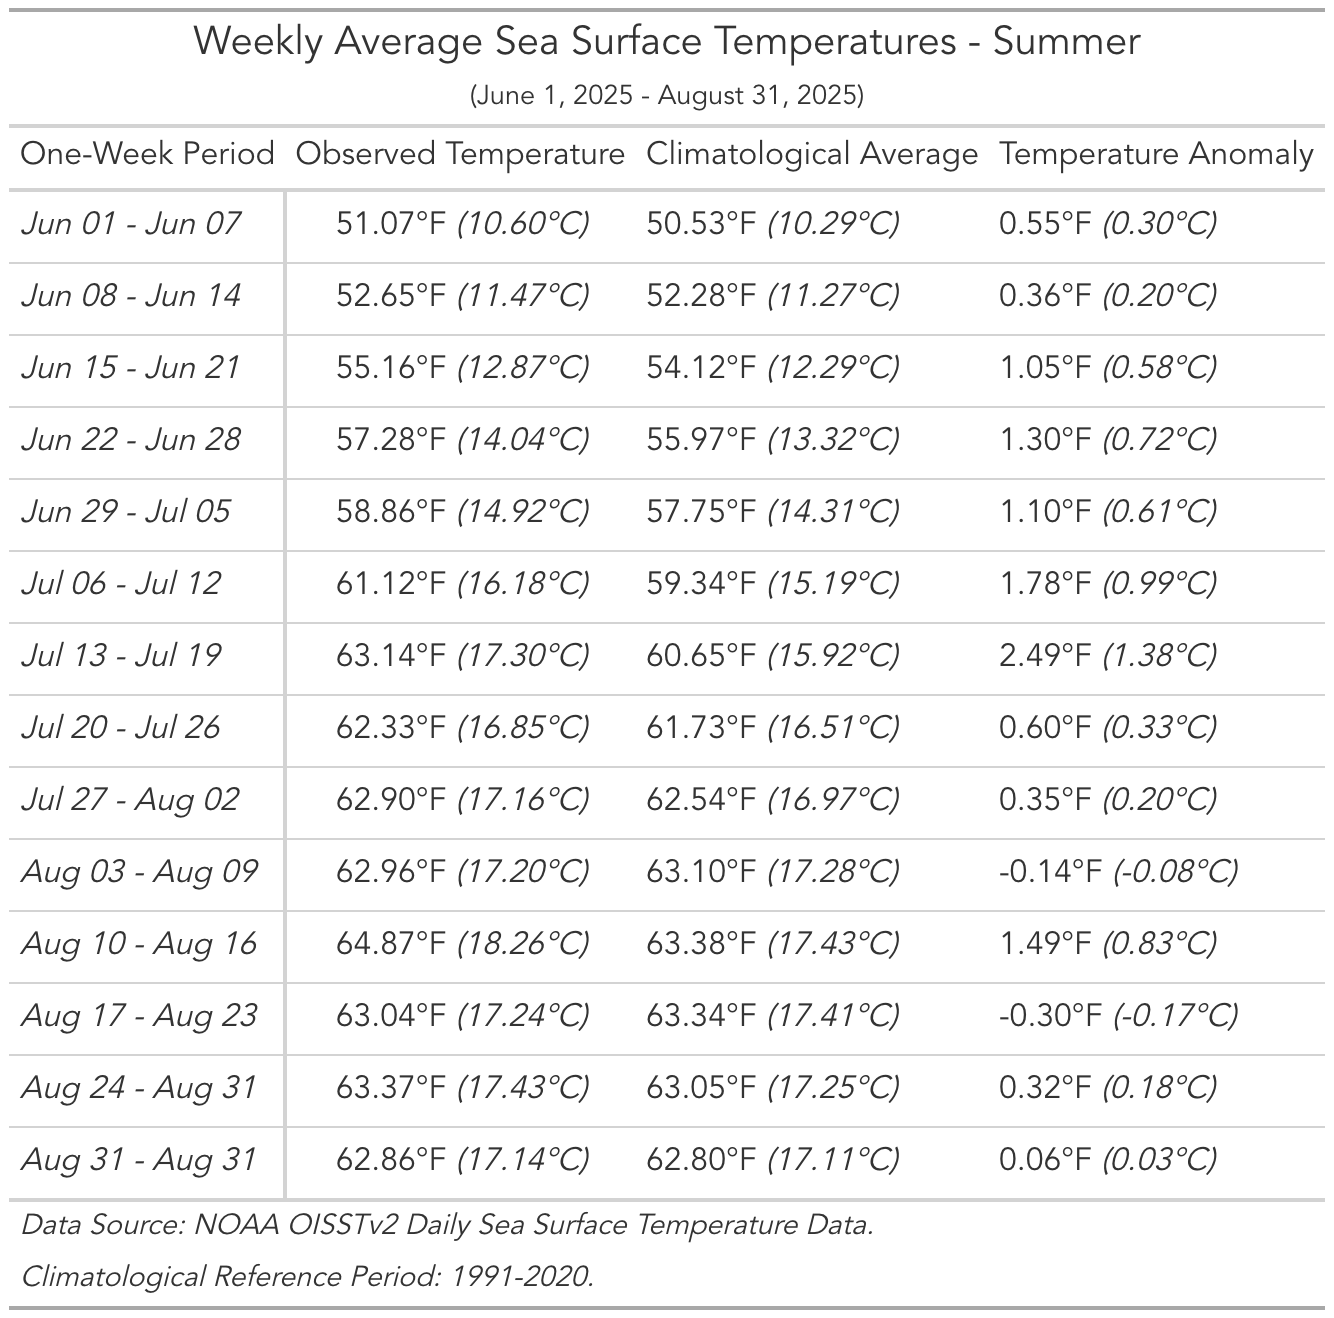
Weekly Temperatures
Table 1 highlights how the SST for each week this summer compares to the 1991 – 2020 CRP for the area shown in Figure 1.
The observed SST, long-term average SST during the CRP, and SST anomalies (i.e., departures from the long-term average SST) are shown.
Weekly SST anomalies this summer ranged from as high as +2.49°F during mid-July, to as low as -0.30°F in mid-August.
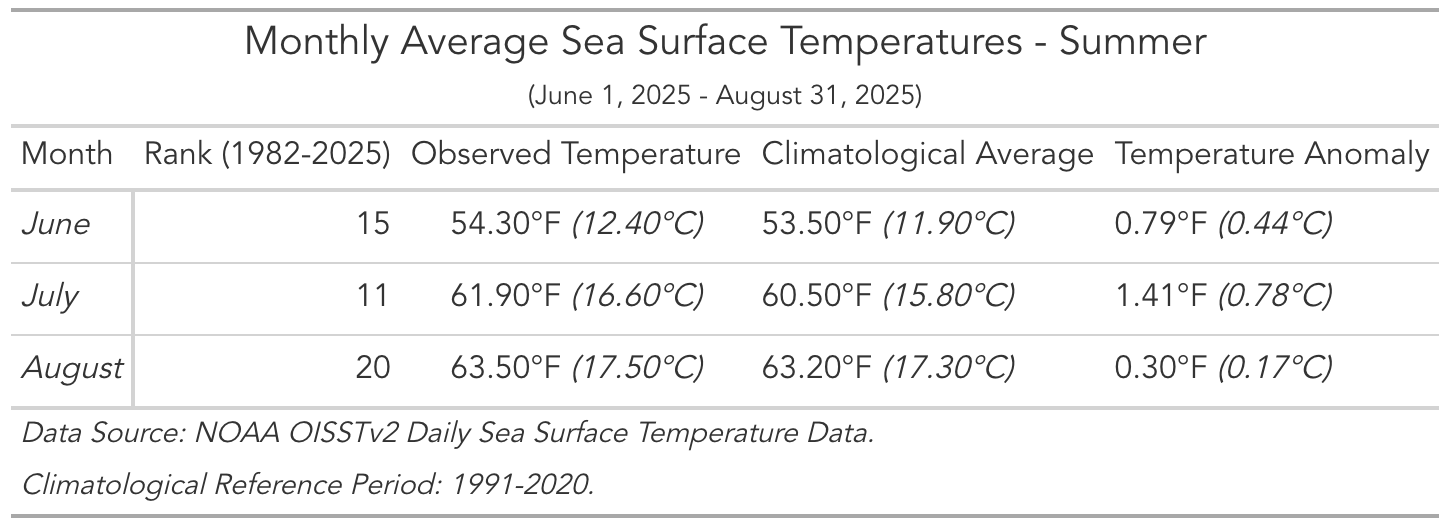
Monthly Statistics
Table 2 shows the average monthly SSTs for the summer of 2025. The SST in June was above the 1991 – 2020 CRP. The SST anomalies became even warmer during July and then cooled, but remained positive, for August. July SST deviated most from the long-term climatological average, with an average SST anomaly of 1.41°F.
How Does this Summer Compare to the Past?
2025 was the 15th warmest (30th coldest) summer season observed in the Gulf of Maine during the 44 years we have satellite data to analyze.
Seasonal Trends and Long-Term Global Context
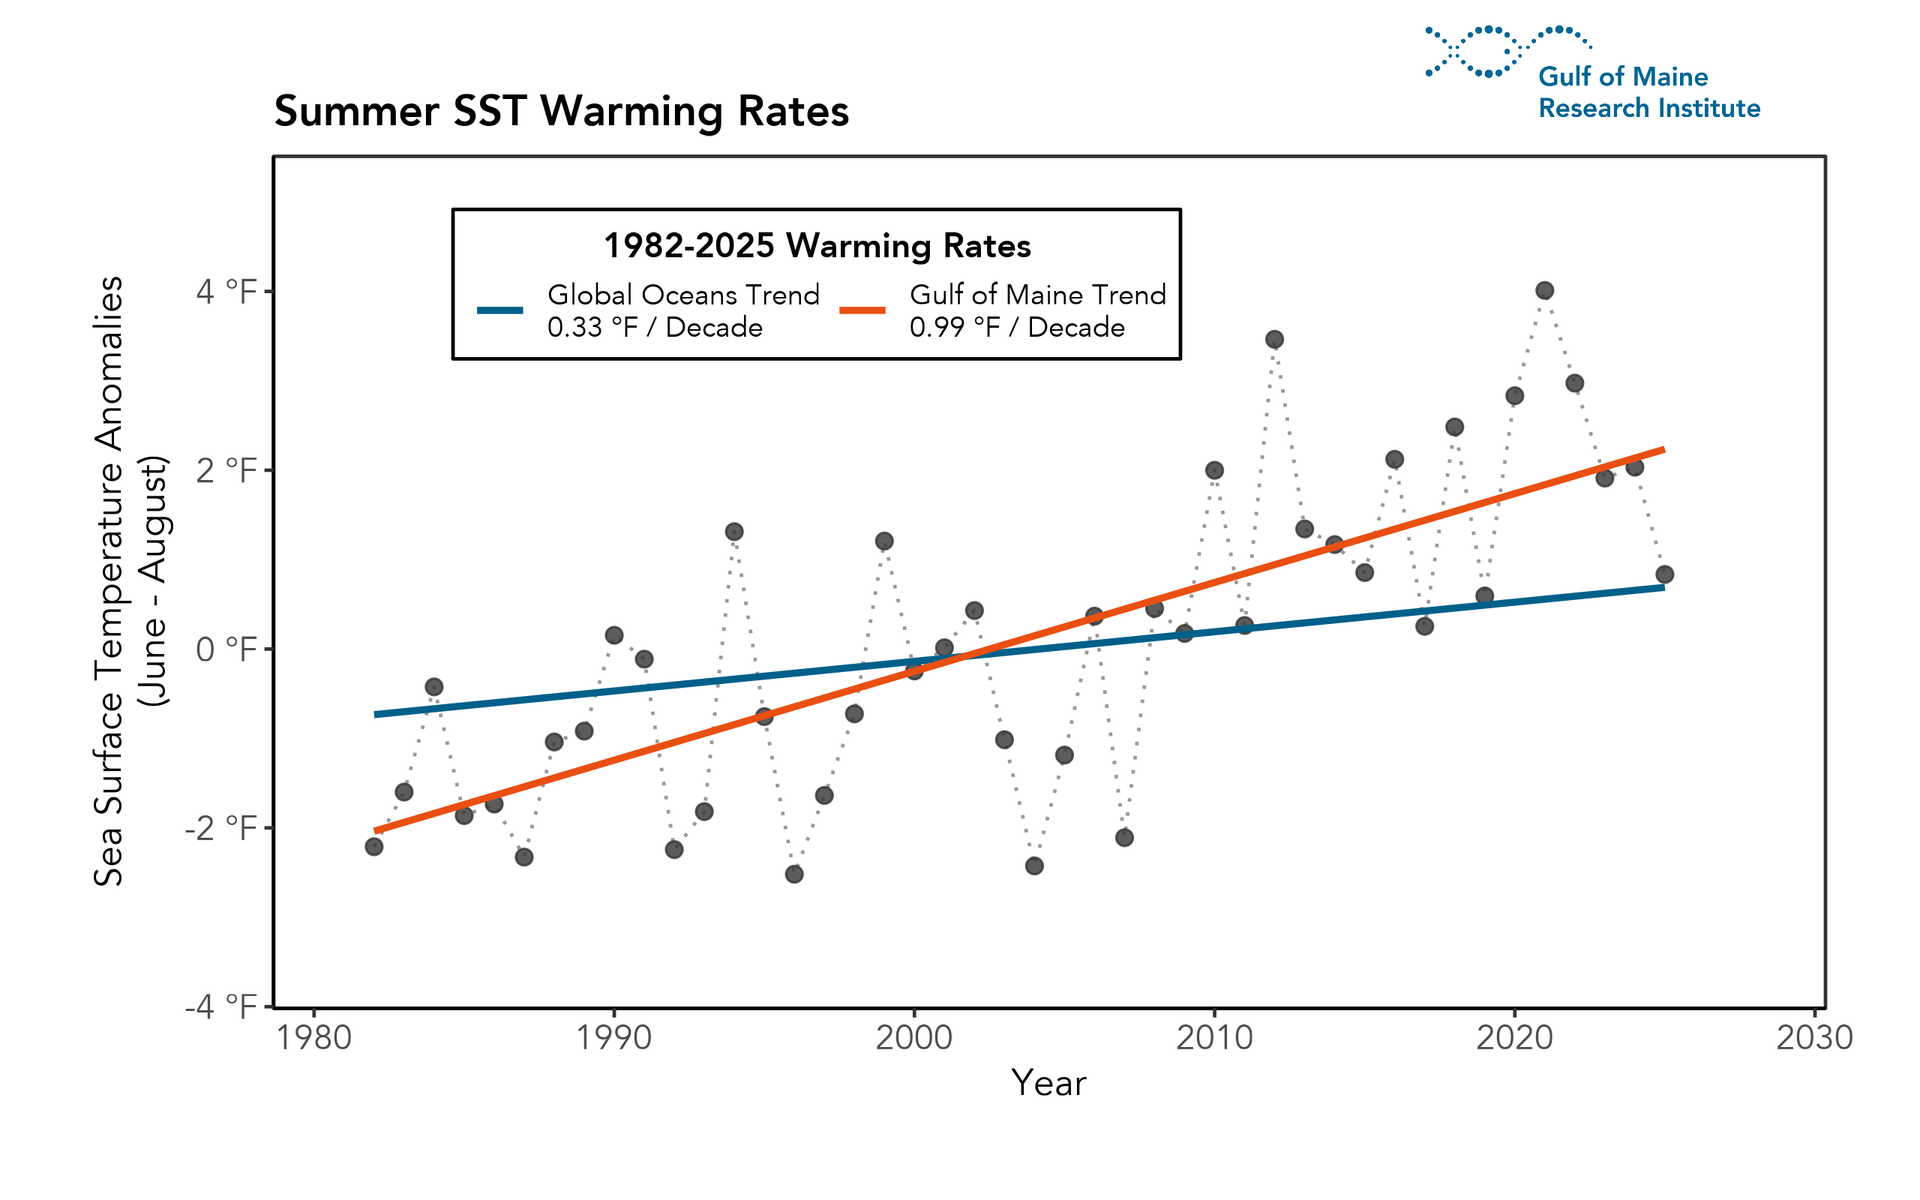
The Gulf of Maine is an area of particular interest to the scientific community due to the remarkable rate of warming it has experienced in recent years.
Figure 3 illustrates the average summer temperature anomaly for each year in the Gulf of Maine, overlaid with long-term SST anomaly trends for the Gulf of Maine (orange) and global oceans (blue).
The summer rate of warming for the Gulf of Maine (0.99°F per decade) is three times faster than the summer warming rate across the oceans globally (0.33°F per decade).
Extreme Temperature Conditions
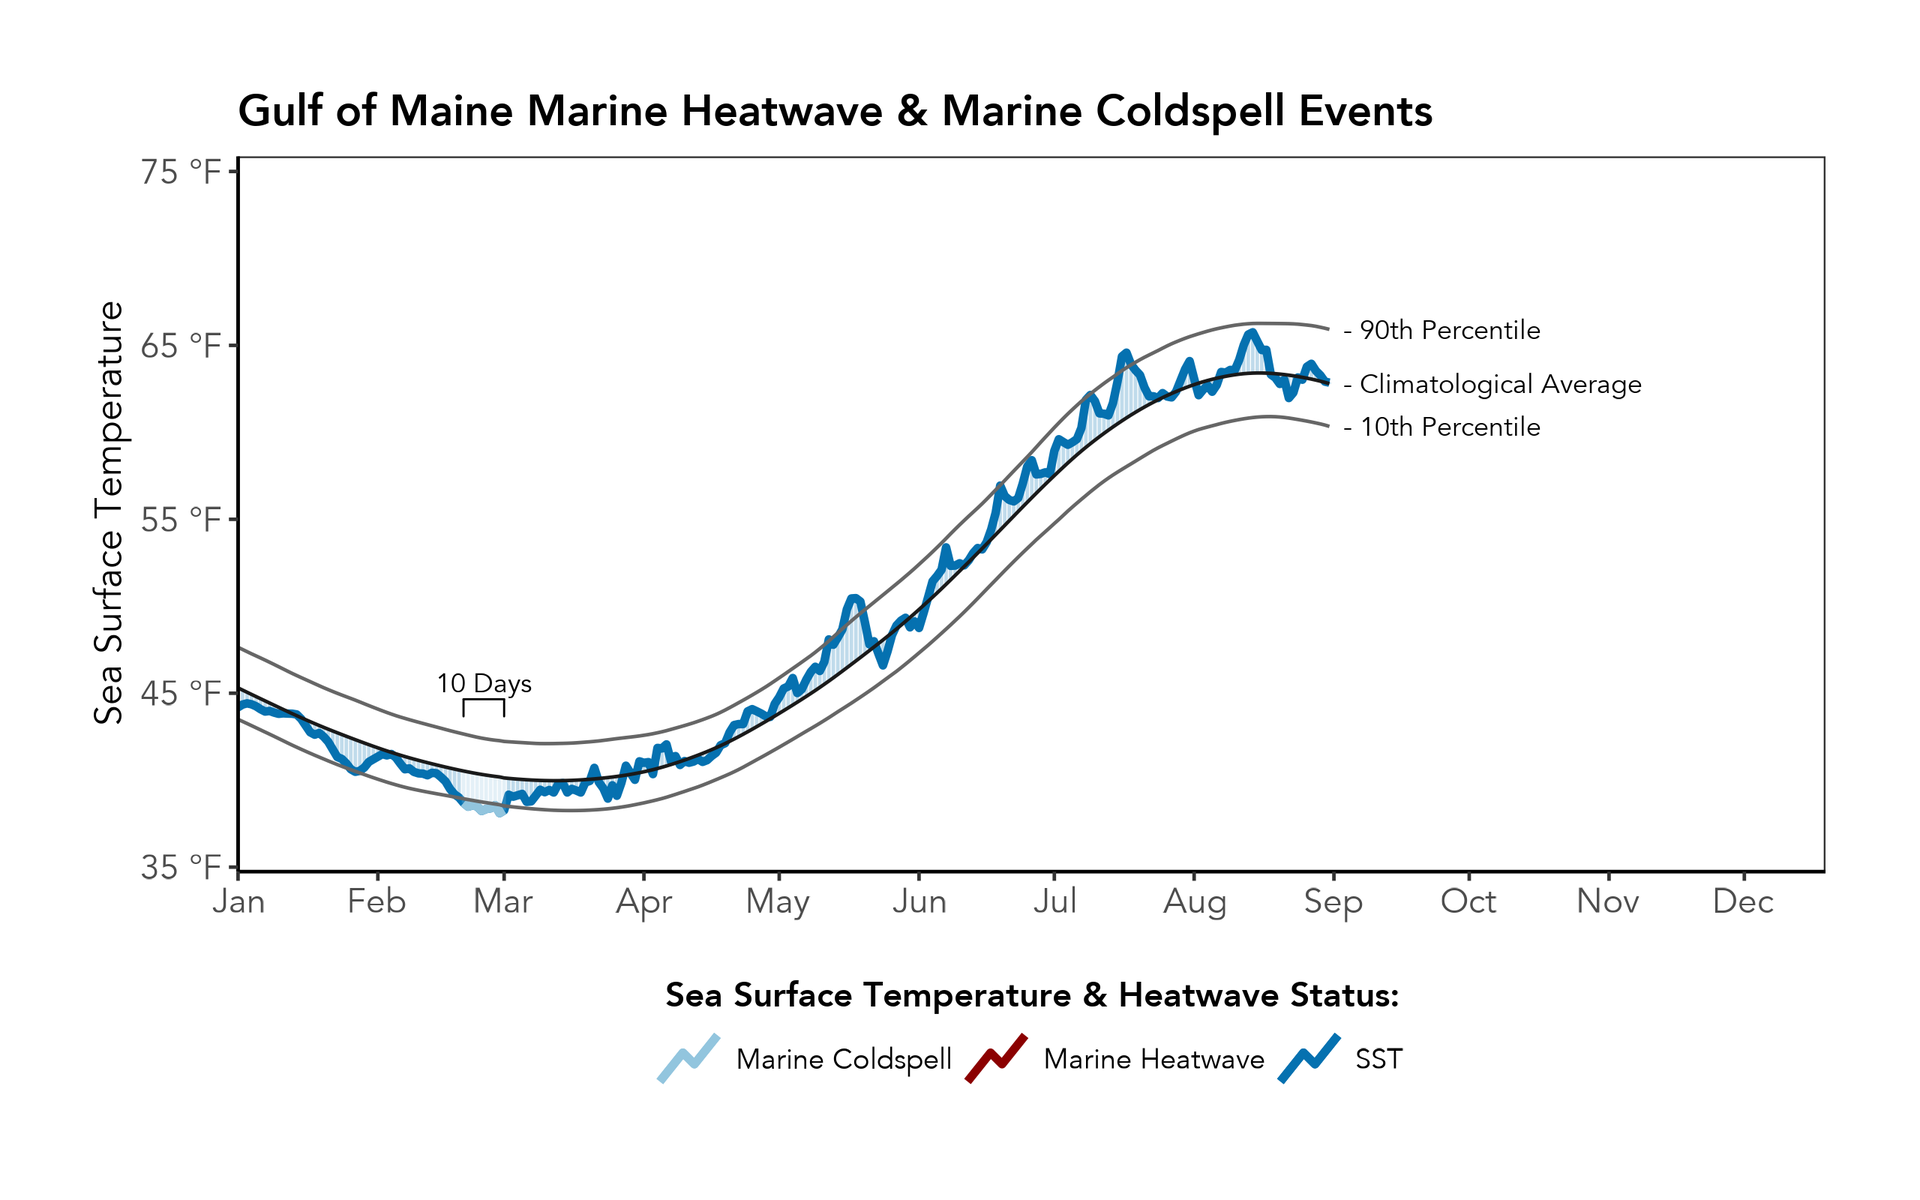
A “marine heatwave” (MHW) is defined by daily average SSTs that exceed the 90th percentile of a climatological (i.e., 30-year) average for at least five consecutive days. A “marine coldspell” (MCS) is the cold-temperature counterpart to a MHW, and is identified using the same approach, but for temperatures below the 10th percentile. Gaps of two days or less in exceeding the threshold do not constitute a break in a single MHW/MCS event.
Using this broadly accepted definition, the Gulf of Maine has experienced no MHW or MCS events this summer (Figure 3). There was a brief period of temperatures above the 90th percentile threshold during May, but conditions did not persist for five days (only four days).
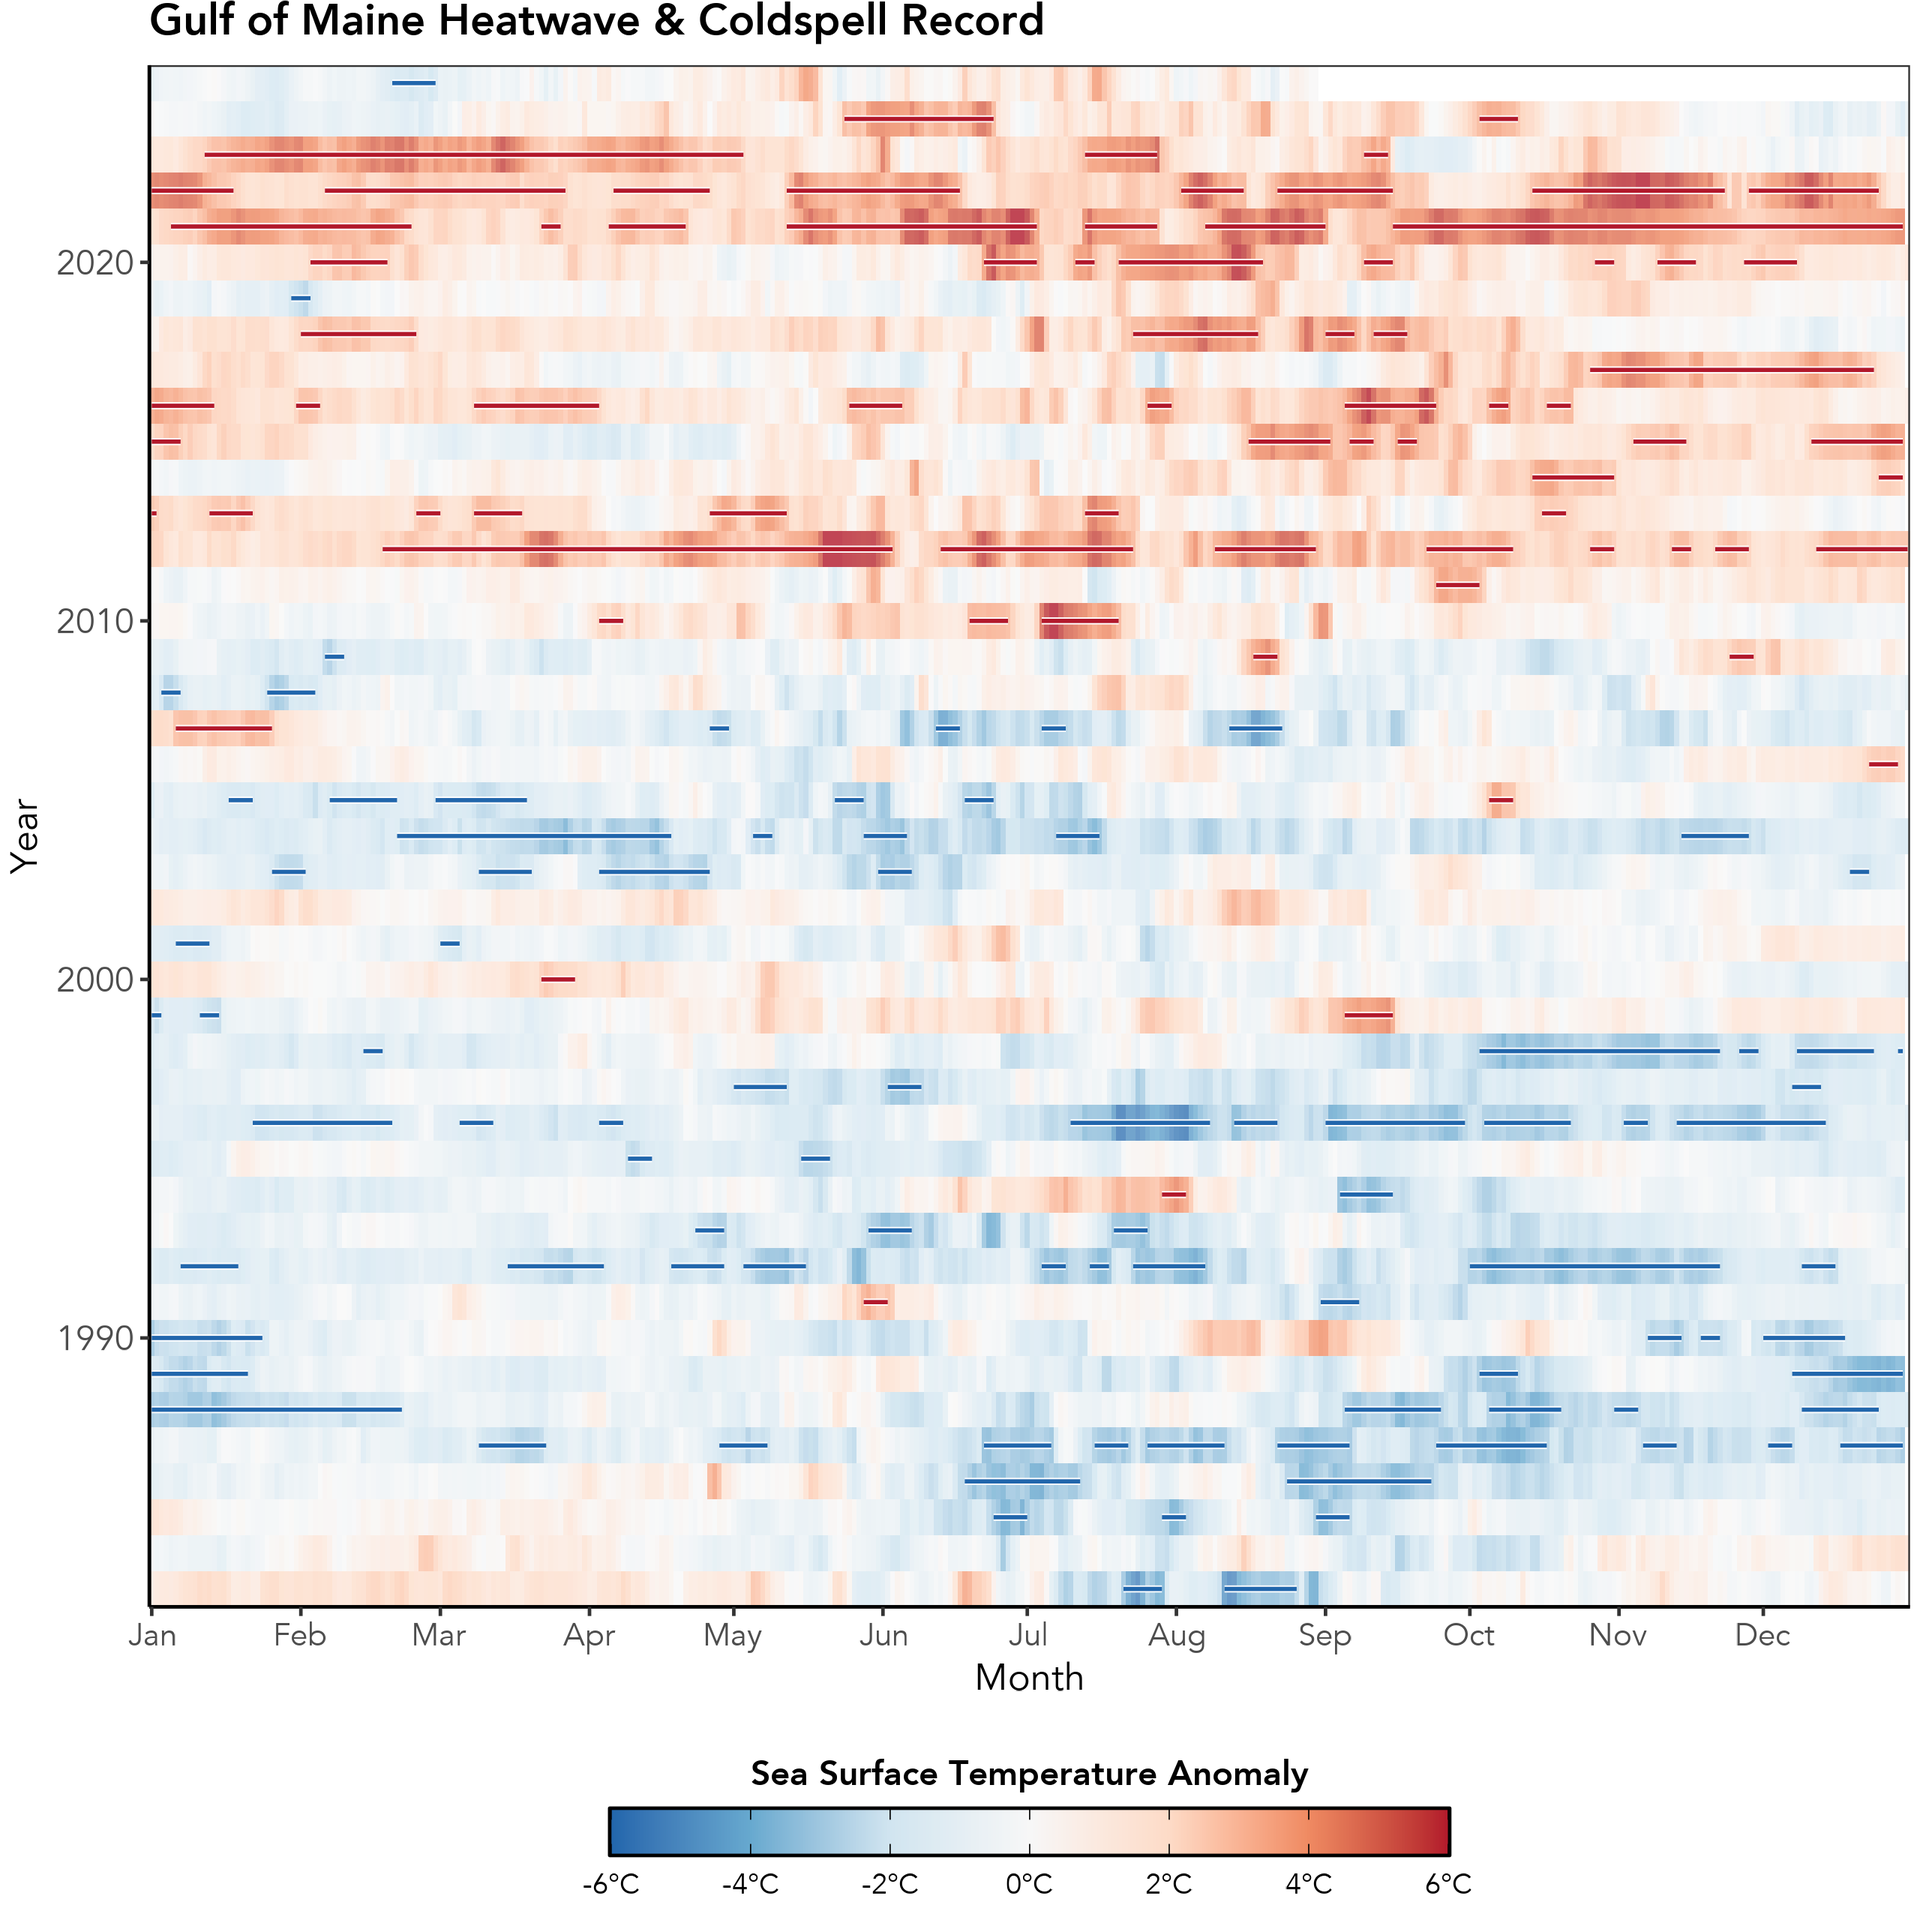
Heatmap of Temperature Anomalies and Extreme Events
Using our standard definition for extreme events, summer 2025 was mild with respect to MHW/MCS conditions, with no extreme hot or cold SST events occurring since the brief winter coldspell (Figure 4).
Elevated SST conditions (Figure 4, darker red shading) have been more frequent and persistent after 2010 and throughout the early 2020s in the Gulf of Maine. During this period, the frequency, duration, and intensity of marine heatwaves (Figure 4, red lines) have been more pronounced. Marine coldspells (Figure 4, blue lines) were common in earlier decades but have become rare, with only two short coldspells occurring in the last 15 years.
Spatial Distribution of Seasonal Anomalies
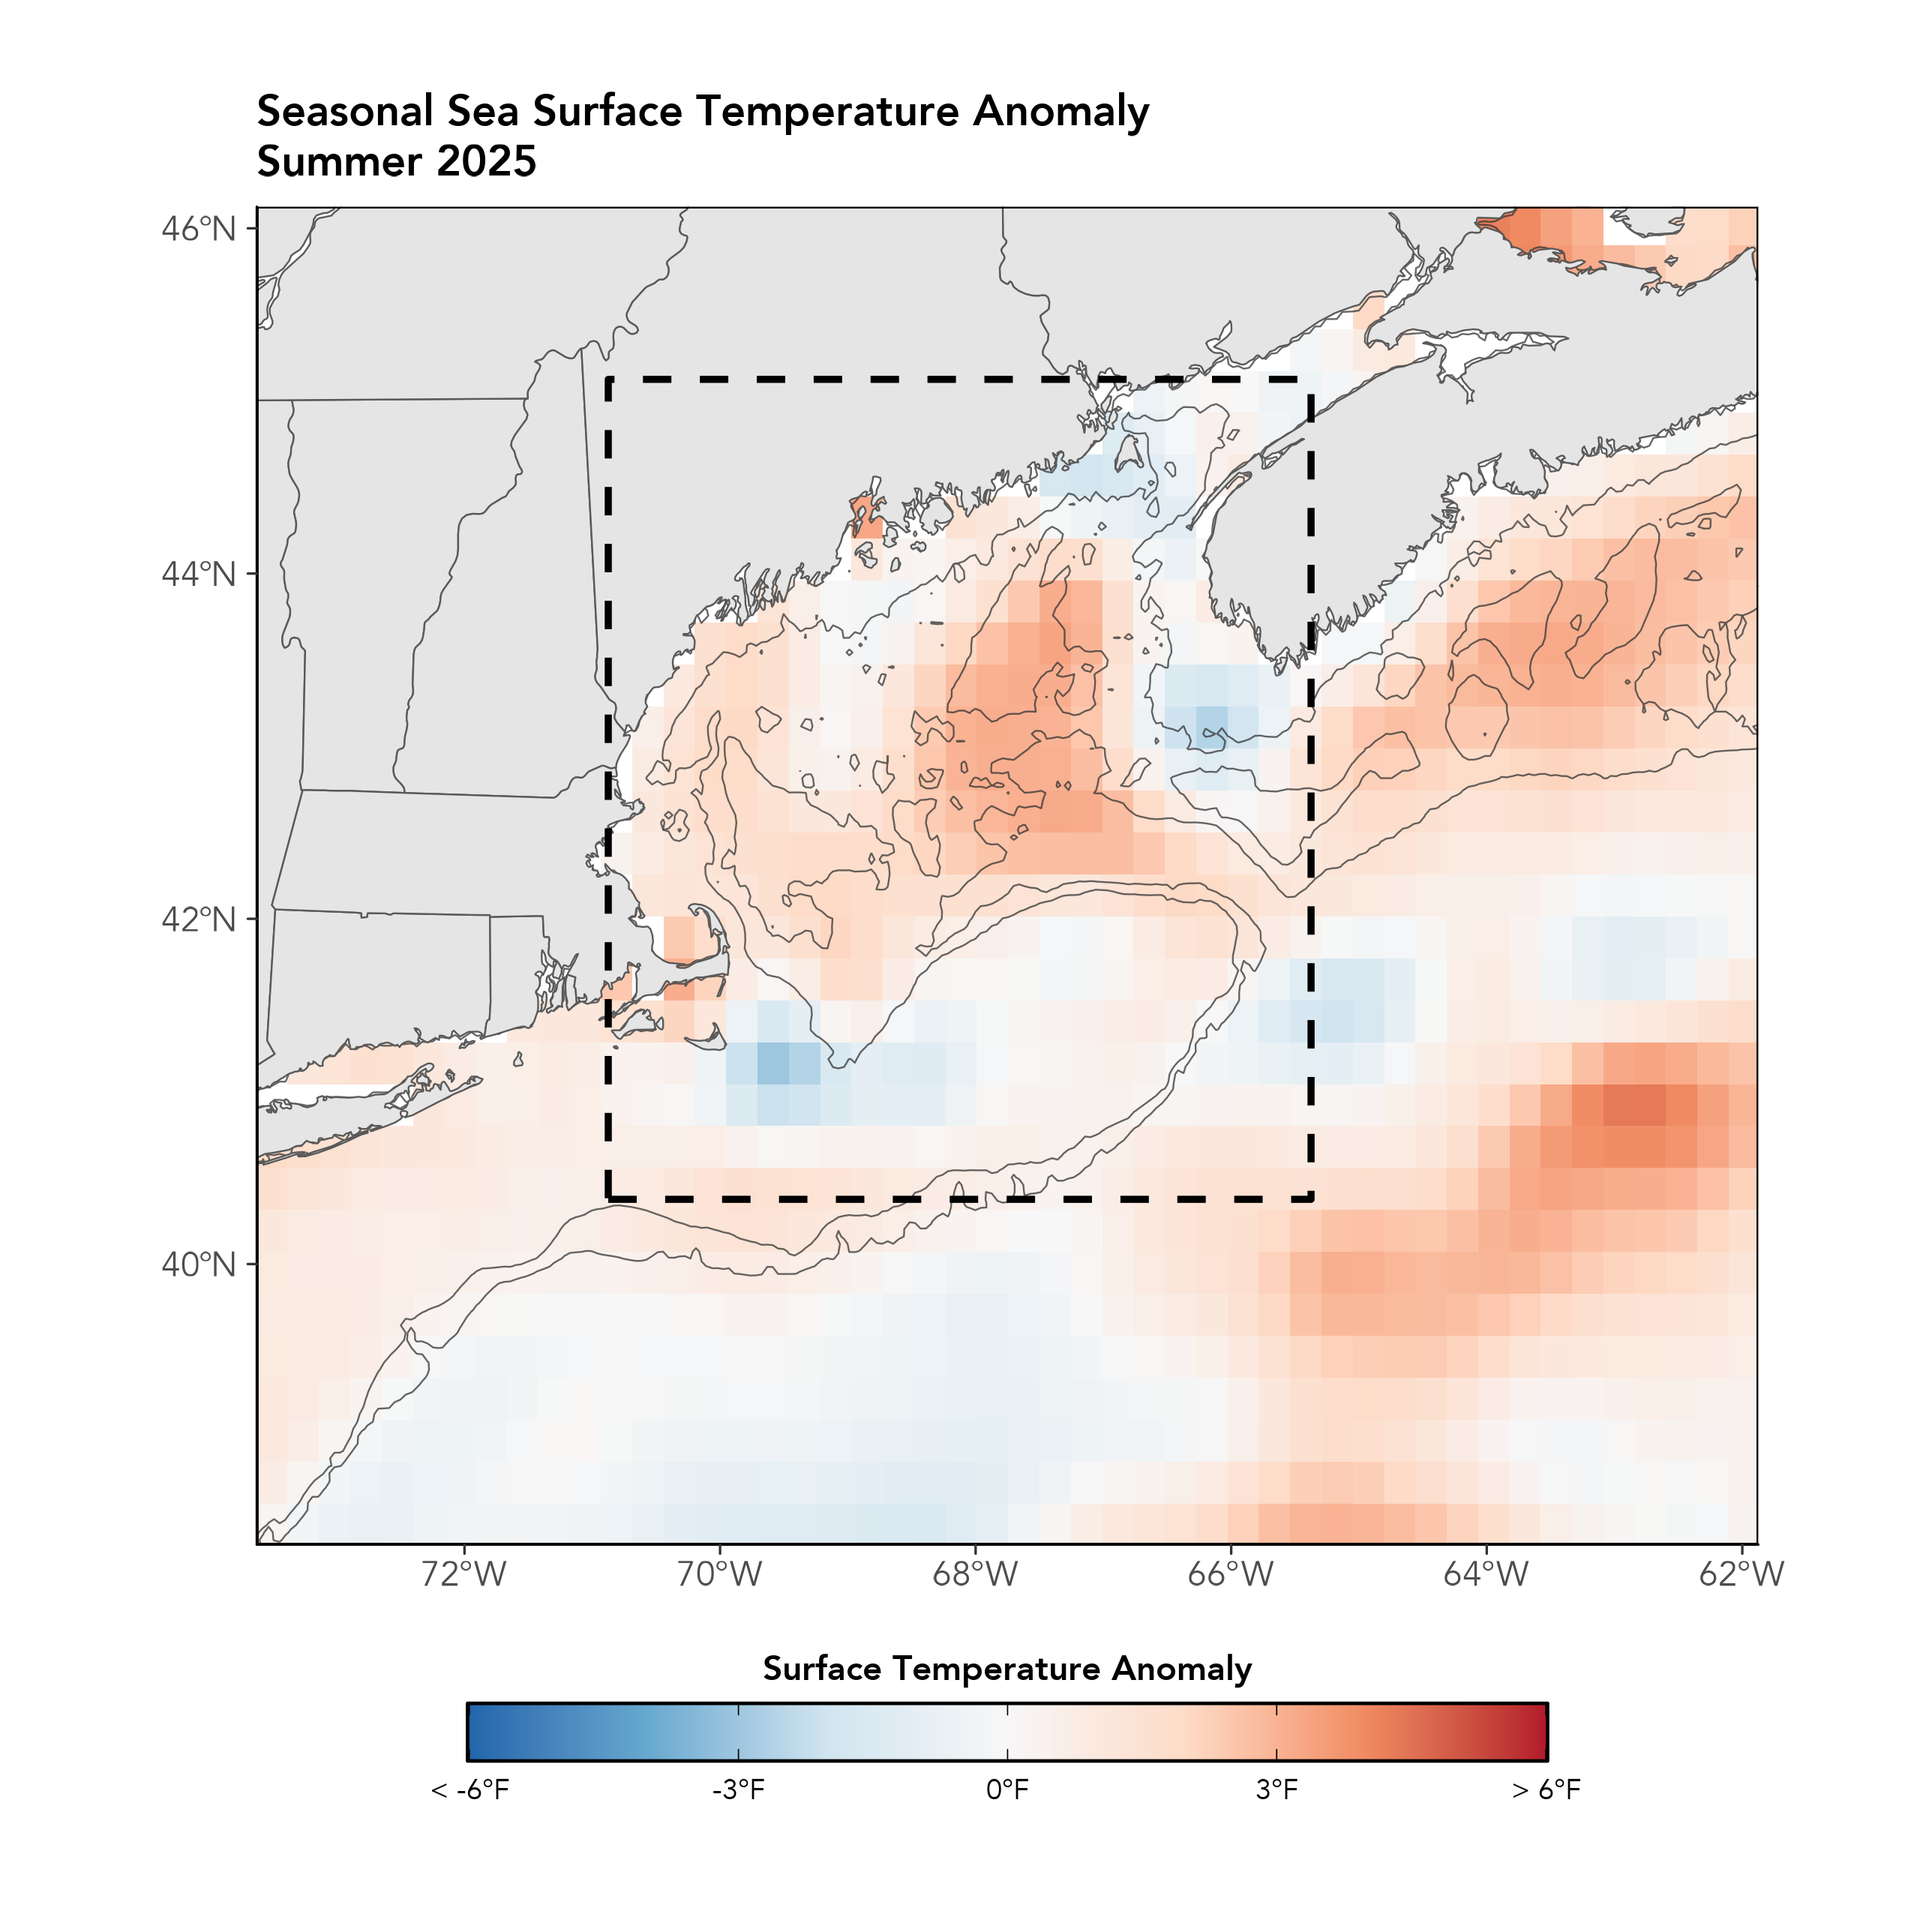
When viewed spatially, much of the Gulf of Maine region and the adjacent on-shelf areas experienced warm SST anomalies during summer of 2025 (Figure 5). Cool SST anomalies were found off the southern tip of Nova Scotia, the Nantucket shoals, and along the coast of downeast Maine into the mouth of the Bay of Fundy. Above-average SSTs occurred more within the interior of the Gulf of Maine, along the Western Gulf of Maine as well as the deeper waters just-inside the Northeast channel.
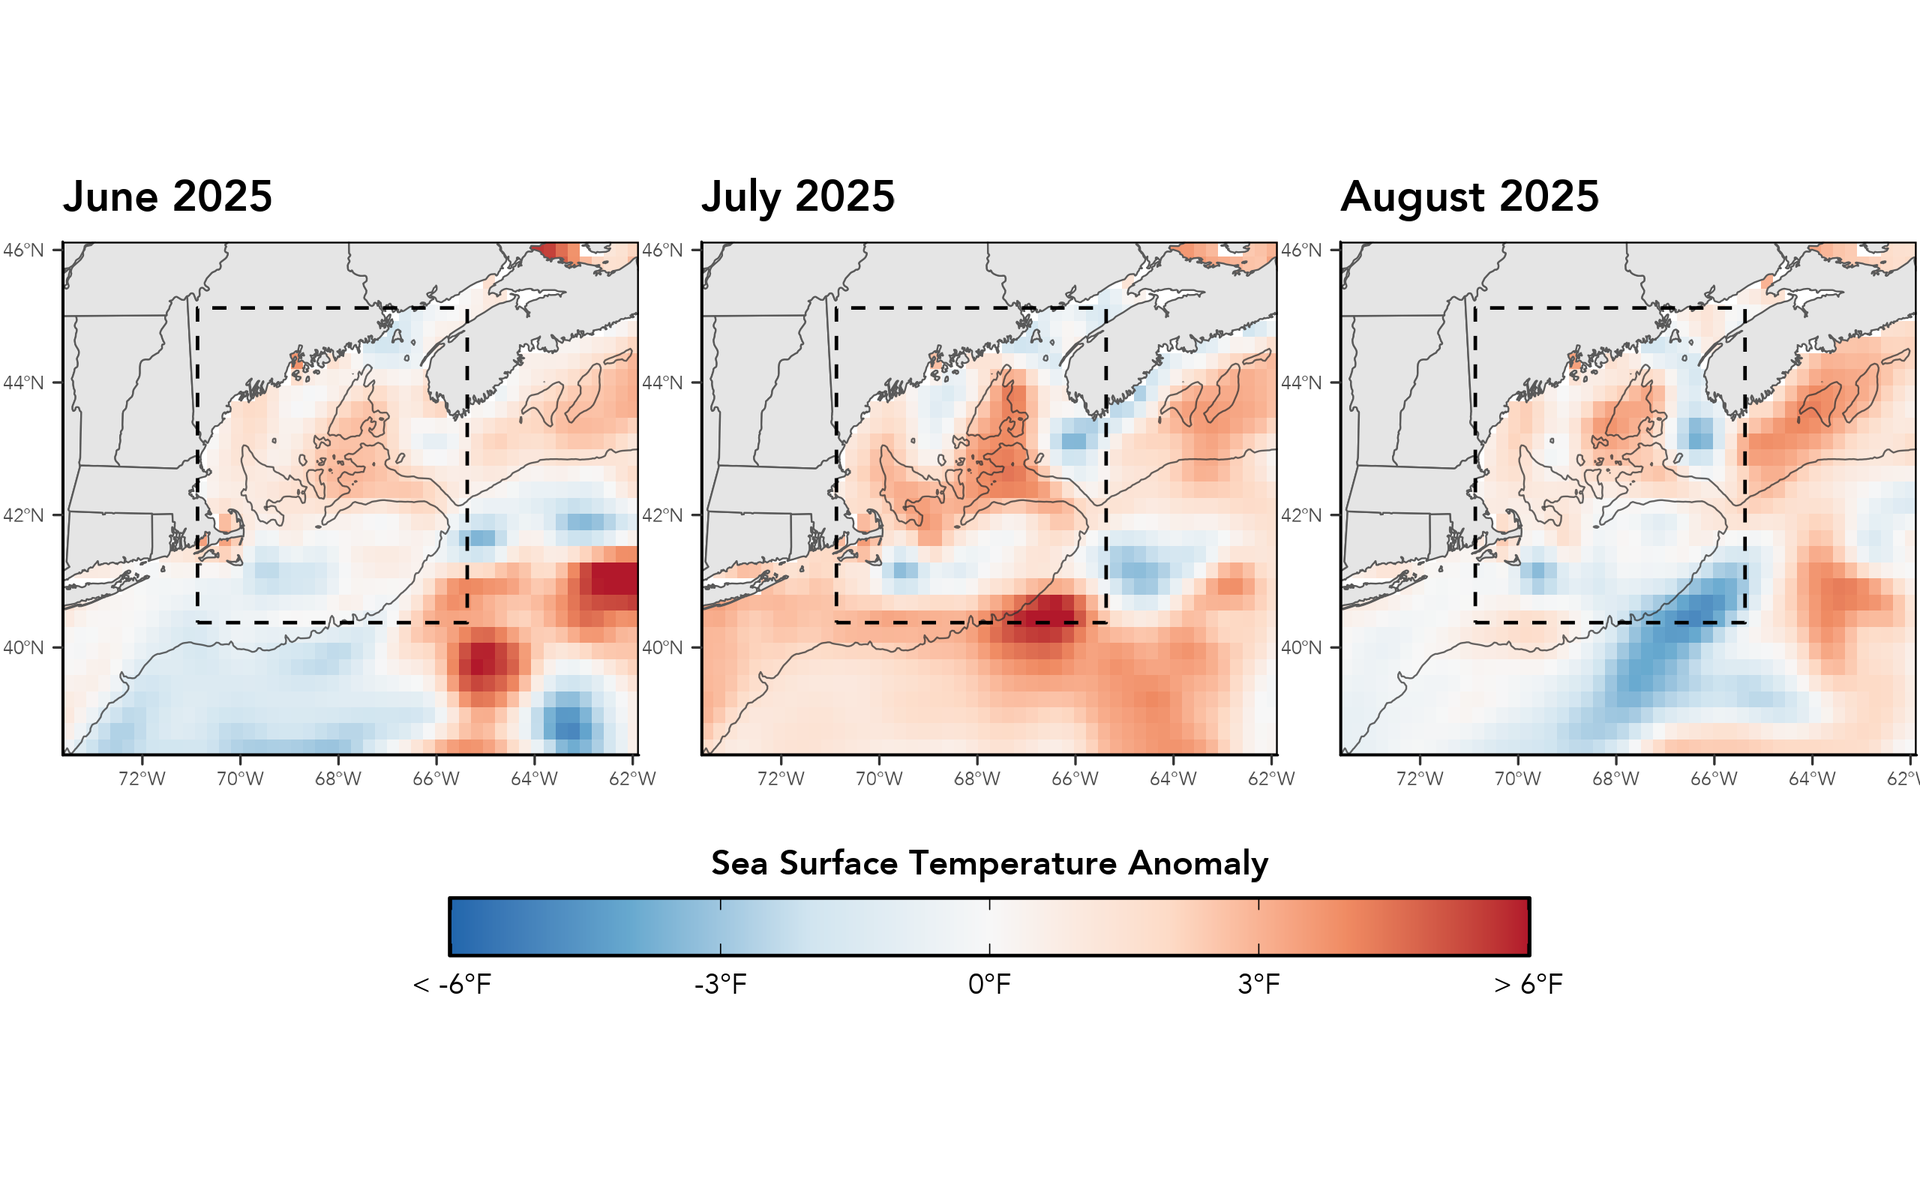
Spatial Distribution of Monthly Temperature Anomalies
Monthly average SST anomalies for Summer 2025 are shown spatially in Figure 6. During June, mild above-average SSTs occupied the interior of the Gulf of Maine, with below-average anomalies positioned over the Nantucket Shoals and in the mouth of the Bay of Fundy. During July, the above-average conditions were widely distributed up the coast and in the interior of the Gulf of Maine, with cooler anomalies remaining over Nantucket Shoals, along the coast of downeast Maine into the Bay of Fundy, and off the tip of Nova Scotia. By August, conditions had cooled (relative to the long-term average), with above-average conditions more concentrated within the interior Gulf of Maine over Jordan Basin and below-average SSTs expanding over Georges Bank and remaining off the tip of Nova Scotia and in the Bay of Fundy.
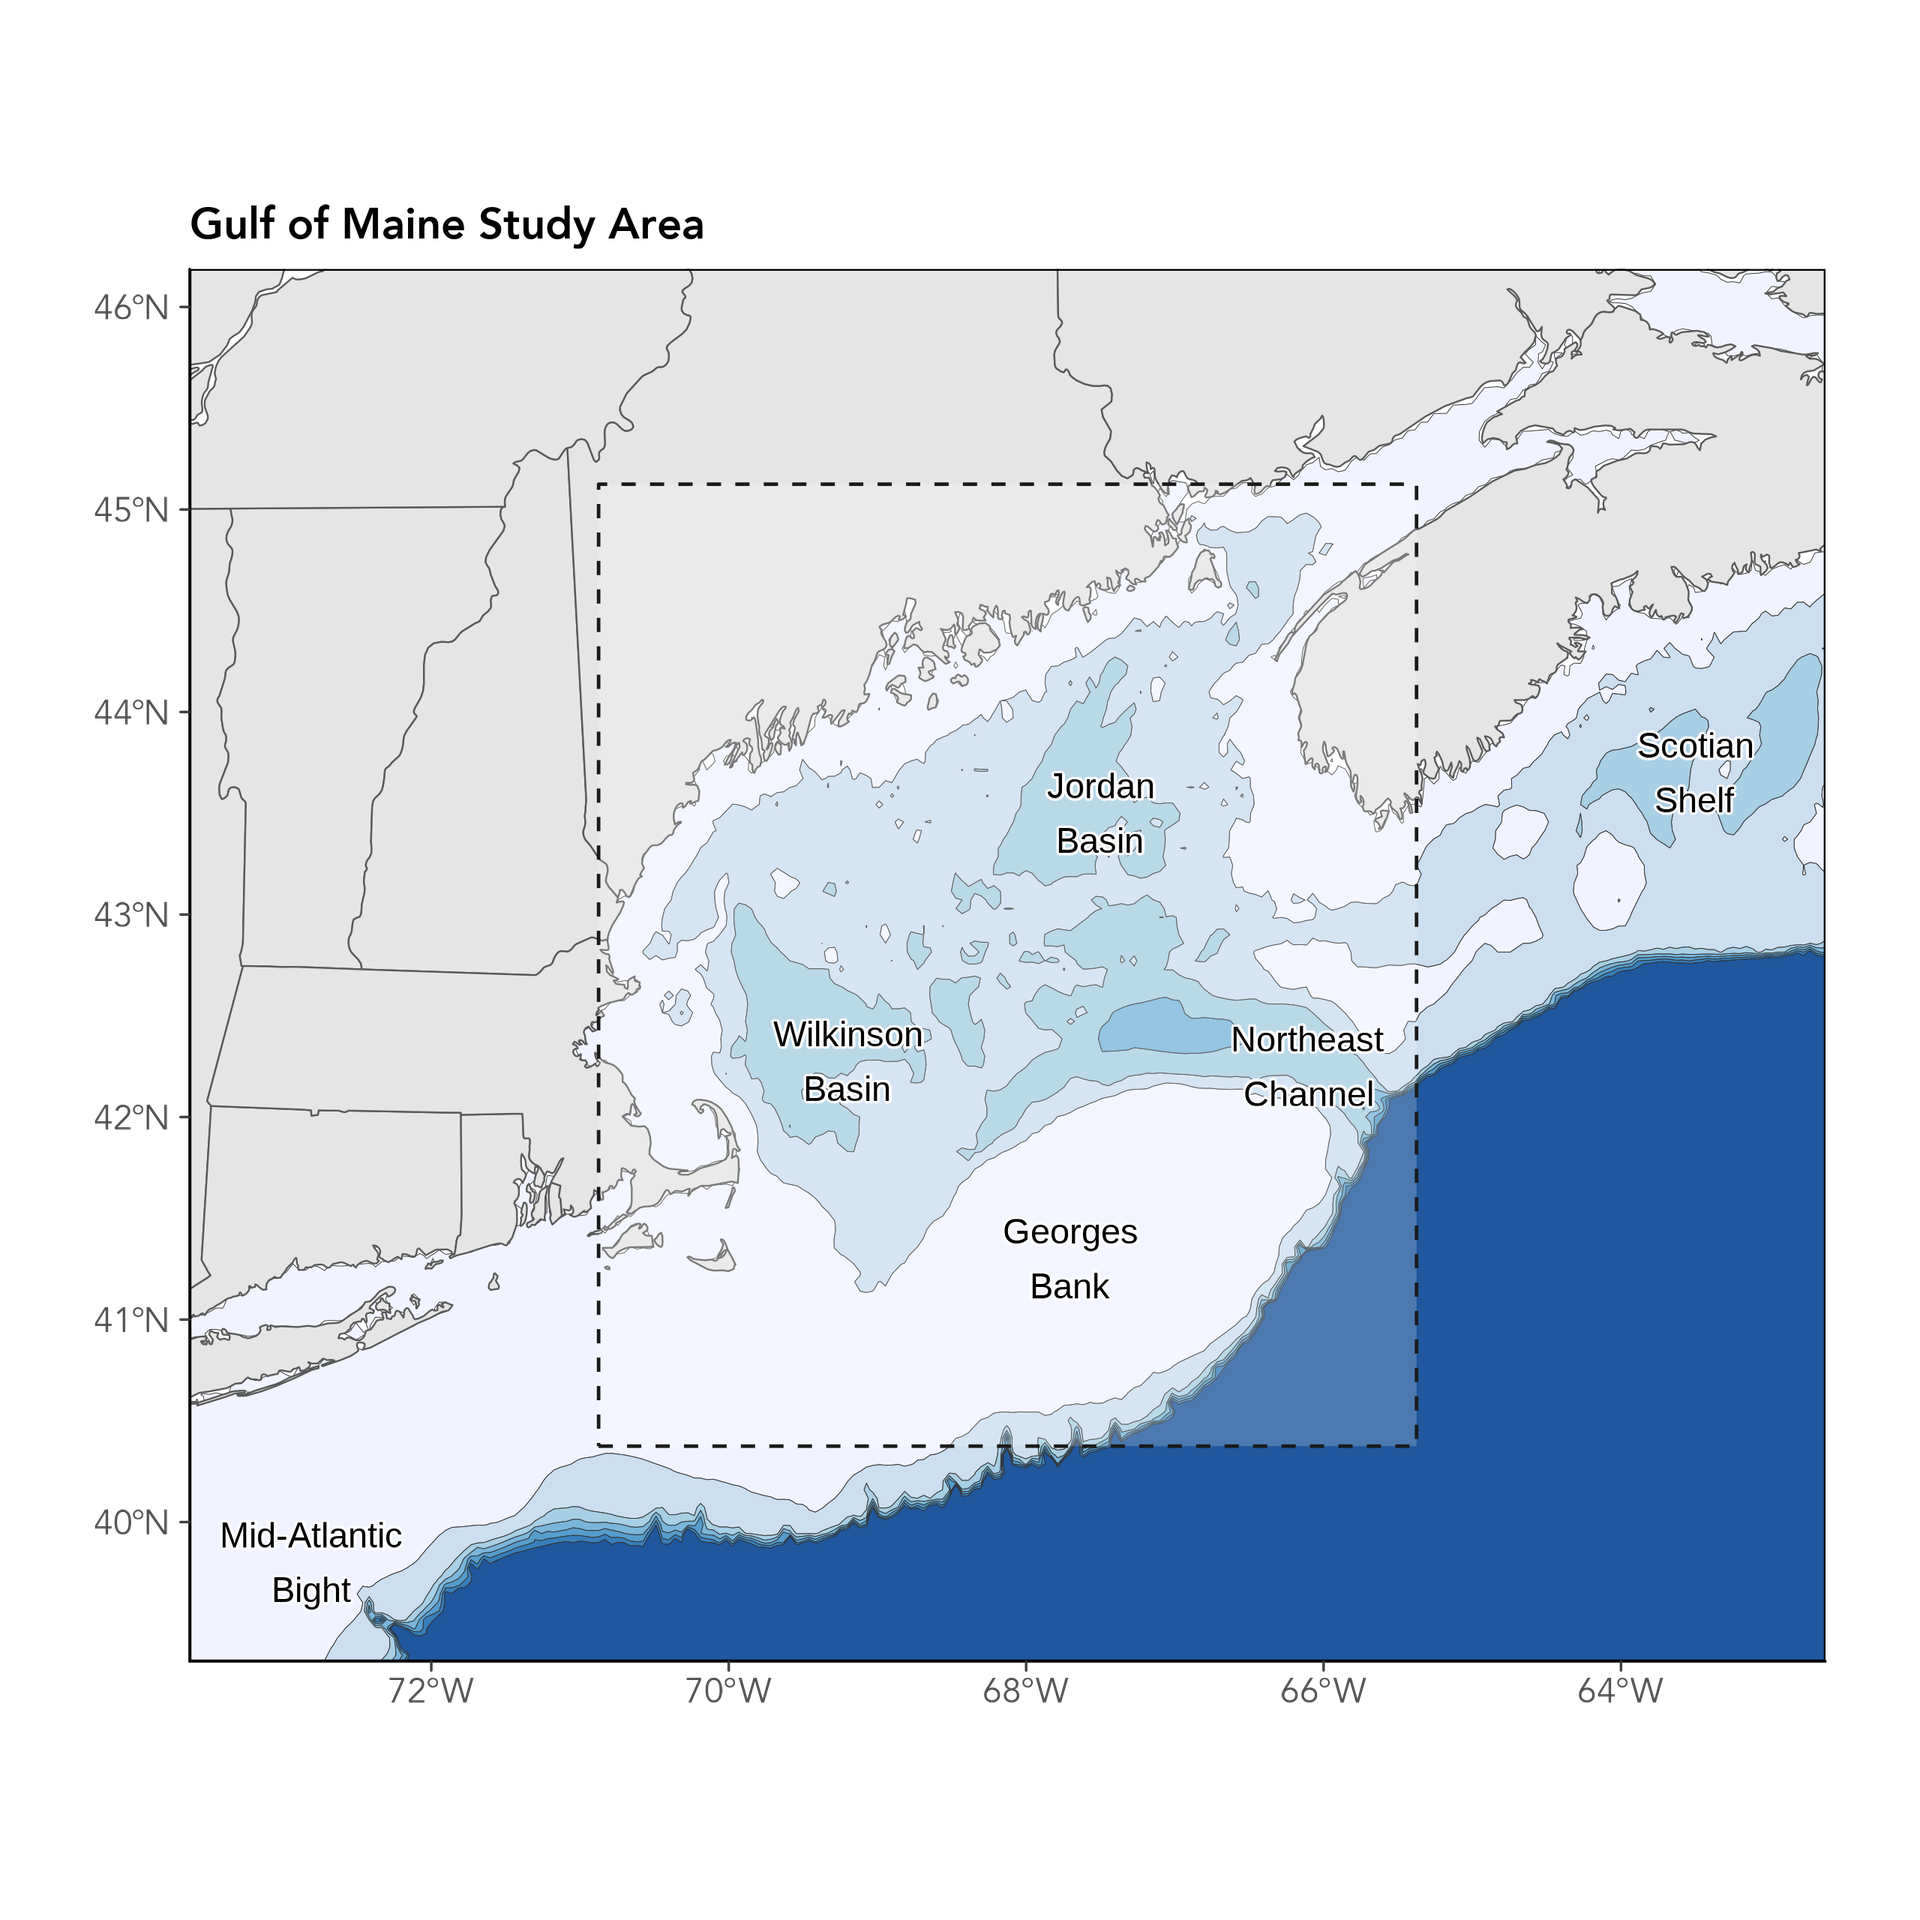
The Gulf of Maine Region
For analyses like these, it is important to be clear about the spatial extent that “defines” the Gulf of Maine (Figure 7), as different borders could produce different results. The spatial domain we use as the “Gulf of Maine” is outlined with the dashed line below. For this body of work we use a rectangular bounding box with longitudinal bounds from -70.875 W to -65.375 W, and latitudinal bounds of: 40.375 N to 45.125 N. This area is consistent with previous seasonal and annual SST reports that scientists at GMRI have produced.
Citing This Work
If you would like to cite this report, please use:
Gulf of Maine Research Institute. 2025. Gulf of Maine Warming Update: Summer 2025 https://gmri.org/stories/gulf-of-maine-warming-update-summer-2025
Note About the Data: The figures in this report are created using remotely-sensed satellite data as part of publicly funded research efforts. Satellite SST data was obtained from NOAA’s National Center for Environmental Information (NCEI), with all maps and figures displaying NOAA’s Optimum Interpolation Sea Surface Temperature Data.


