The Hottest Autumn on Record: Gulf of Maine Seasonal Warming Update
Announcements | Jan 12, 2022
Over the past decade, GMRI scientists have led a body of research that highlights the rapid pace of warming in the Gulf of Maine by analyzing sea surface temperatures (SST) derived from satellite data. To help keep you informed, we share seasonal updates about conditions in the Gulf of Maine. Check out our summer update for important information about data sources and the geographic domain we use to conduct these analyses.

The average SST for the Gulf of Maine during Fall 2021 (Sept 1 – Nov 30) was 59.9°F, more than 4°F above the long-term average. That makes this fall the hottest on record, and this follows what was the second-warmest summer in the Gulf of Maine of all time.
Read on to learn more about what SST conditions were like in the Gulf of Maine during this fall.
Weekly Fall Temperature Averages & Anomalies
Knowing how hot or cold it was in the past gives us a baseline against which we can compare temperatures we observe today. In Table 1, we highlight how the surface ocean temperature for each week this fall (observed SST) compares to a 30-year baseline period (climate average) that spans from 1982 to 2011. The table shows the absolute values as well as the departures from that long-term average (temperature anomaly). Looking at the data this way reveals a stunning result: SSTs in the Gulf of Maine stayed above 60°F through nearly the end of October, almost 6°F above normal levels.

Seasonal Trends & Anomalies in Context
The Gulf of Maine is an area of particular interest to the scientific community, in part, because of the remarkable rate of warming that it has experienced in recent years. When looking at the average fall temperature over the past 40 years (Fig. 1), there is a clear long-term increase, punctuated by a more pronounced increase beginning around 2008. Over that time, fall SSTs in the Gulf of Maine have warmed at a rate of 1.1°F per decade.

This period of faster warming is part of what appears to be a distinct regime shift in the Gulf of Maine. The drivers of this (e.g., a weakening of the Atlantic Meridional Overturning Circulation and shifts in the path of the Gulf Stream) have been well-documented in the peer-reviewed literature, including through research by GMRI scientists. Since 2010, the average fall SST in the Gulf of Maine has not fallen below 57°F. Prior to 2010, it only breached that level once. In other words, temperatures this high were not the norm a couple decades ago, but they are now.
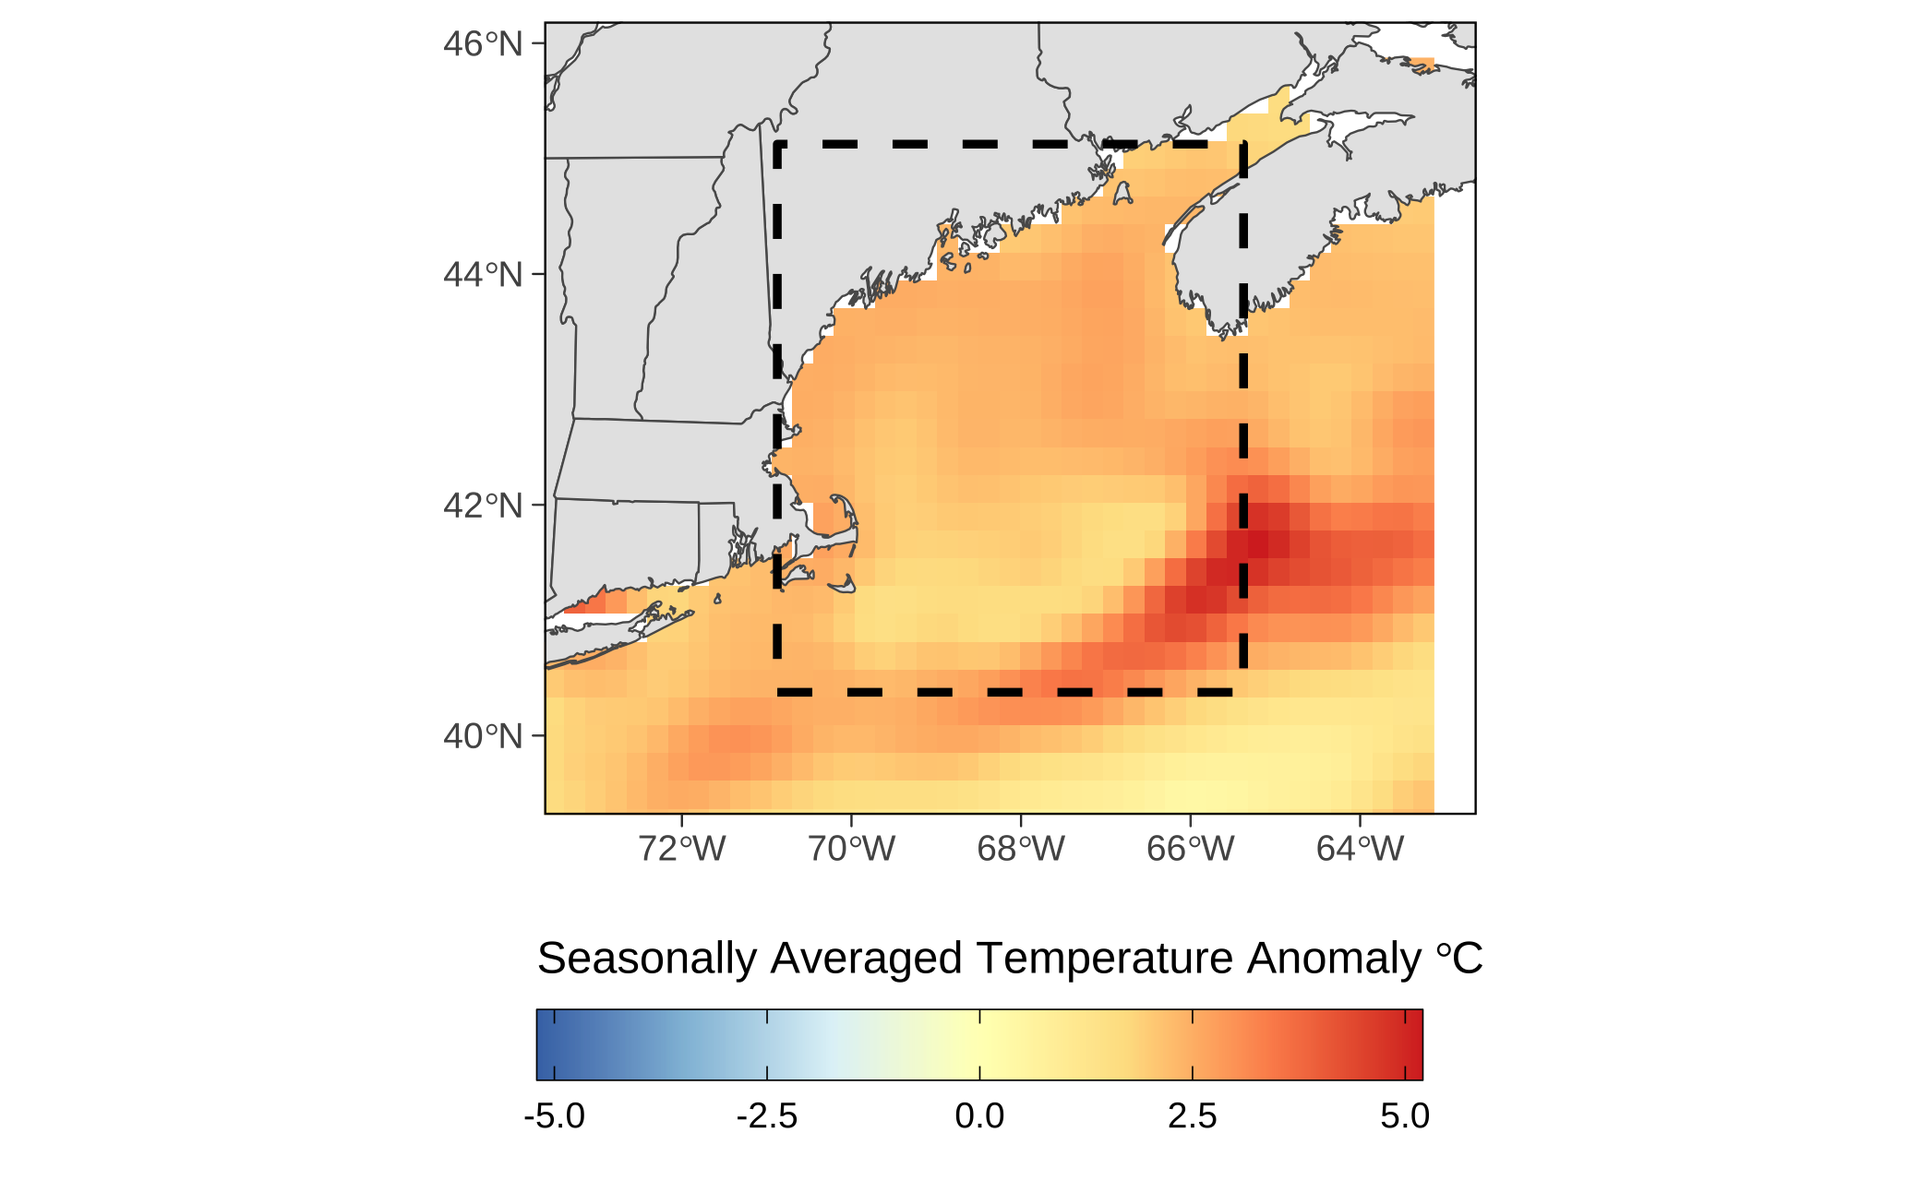
Figure 2 illustrates the spatial pattern of seasonally-averaged SST anomalies across the Gulf of Maine for Fall 2021 (as opposed to looking at the seasonal SST anomalies averaged over the entire Gulf of Maine in a temporal sense, as in Table 1). While it’s starkly evident that the entire region is well above historical norms, there is variability across the region, with slightly cooler anomalies in yellow over what is Georges Bank and substantially warmer-than-average anomalies in the far southeast corner, which would be along the edge of Georges Bank (denoted by the dotted line in Fig. 2). It's this region of dark red that is most susceptible to changes in the influence of the large-scale circulation patterns (e.g., Gulf Stream versus Labrador Current) — and historically experiences more variability.
To put this fall in context, it’s useful to look at the other warmest fall seasons on record. Until this year, 2012 (when a prolonged and intense marine heatwave occurred in the region) was the warmest fall on record, coming in at ~3.6°F above the long-term average. But this was still nearly a 0.5°F cooler than this fall, illustrating just how abnormally warm this fall was. And as Fig. 3 shows, four of the top five warmest fall seasons on record have occurred in the last seven years.

Extreme Heat Conditions Persist in Gulf of Maine
Marine heatwaves (MHW) are defined as five or more consecutive heatwave days. To qualify as a heatwave day, the SST for that day must be higher than 90% of the same calendar days during the 30-year baseline period (1982 – 2011). Successive heatwaves with gaps of two days or less are considered part of the same heatwave, and not separated into distinct events.
Using this broadly accepted definition, the Gulf of Maine has experienced MHW conditions for almost all of 2021, with only brief reprieves in mid-March, late April, and during the transition from July to August (Fig. 4). The Gulf of Maine has been experiencing sustained MHW conditions since August with the daily temperature anomaly peaking at 6.3 F above the long-term average on October 16th, 2021.

Perhaps a clearer way to see the progression away from the temperature regime of the 1980s and 1990s and into the warmer conditions in recent years, is through a heatmap plot (Fig. 5). In this heatmap, each row represents a year and each day within the year is colored in accordance to how hot or cold it was relative to the 30-year baseline period. The increasing prevalence and darker shades of red in recent years highlight the persistence of exceptional deviation from the long-term average temperatures. The black lines illustrate MHW events, highlighting the increasing frequency of periods in heatwave conditions in recent years. Indeed, 2021 nearly mirrors 2012 in that the Gulf of Maine has been in a nearly-continuous MHW state.

For more information on other climate-related events, metrics, and trends in the Gulf of Maine region (both on land and the ocean), check out the Gulf of Maine Quarterly Update & Outlook compiled by the Northeast Regional Climate Center, which includes contributions from GMRI.
Contributing Scientists
-
![the staff photo for Kathy Mills]()
-
![This is the staff photo for david reidmiller]()
-
![Adam Kemberling]()
Adam Kemberling
Former Quantitative Research Associate