Gulf of Maine Warming Update: Summer 2021
Announcements | Oct 26, 2021
Over the past decade, scientists have led a body of research that highlights the rapid pace of warming in the Gulf of Maine. To help keep you informed, we share seasonal updates about conditions in the Gulf of Maine.
Read on for an inside look at what we've learned in our 2021 Gulf of Maine warming update.

Nearly a decade ago, GMRI scientists revealed how rapidly the Gulf of Maine was warming relative to the rest of the world. In that time, we’ve seen continued warming and marine heatwaves (MHW) that have caused significant disruption to the region’s seafood supply chain, but also gave us a chance to pursue different adaptation approaches to such extreme events.
By sharing these seasonal updates of sea surface temperatures (SST) in the Gulf of Maine, we hope to provide the public with a greater understanding of the conditions in our cherished waters, contextualize them historically and globally, and give a little insight into why it all matters.
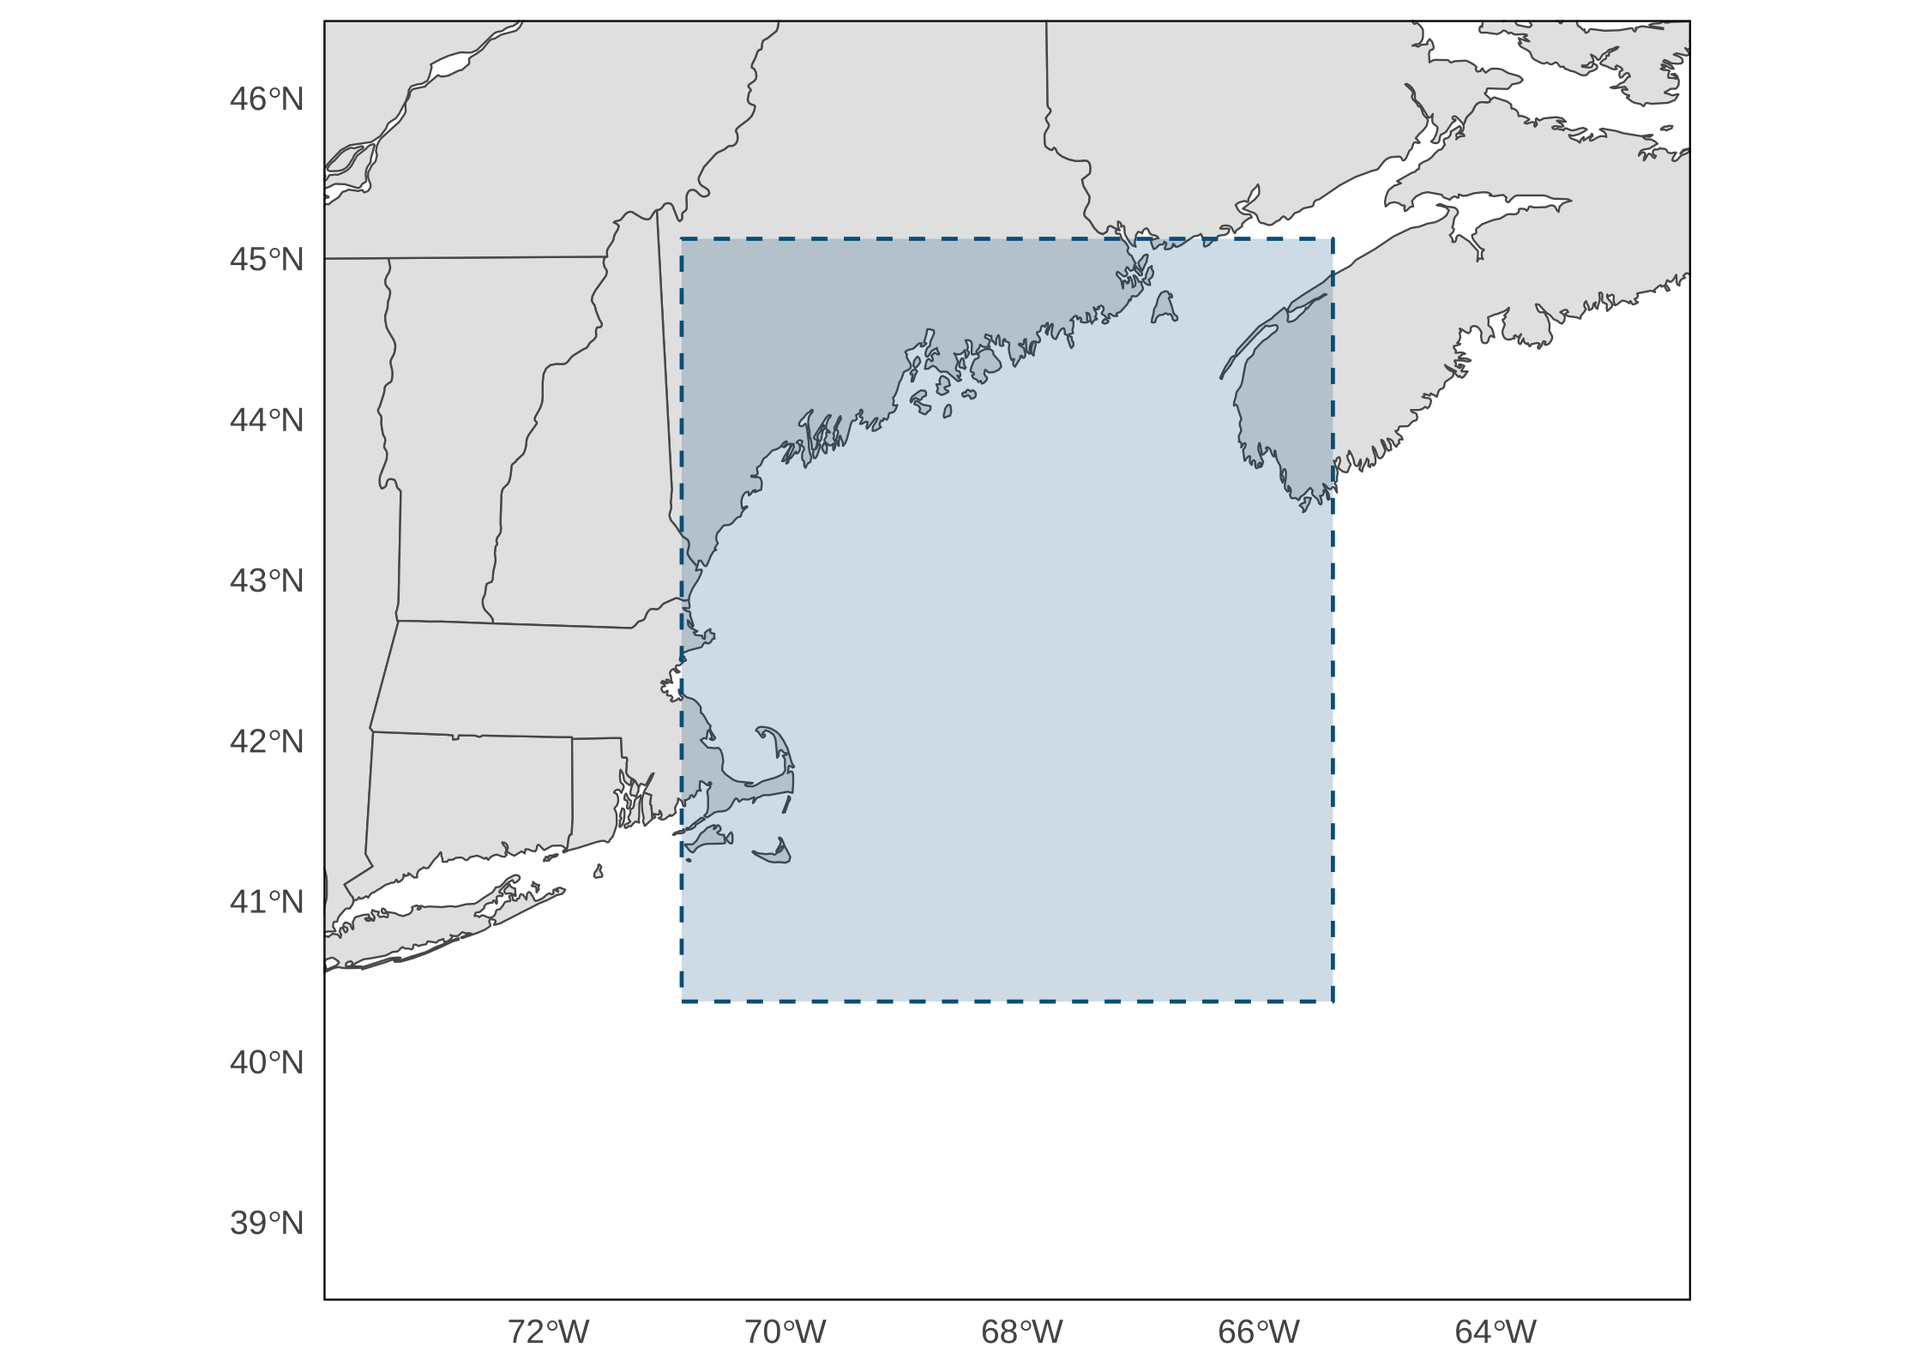
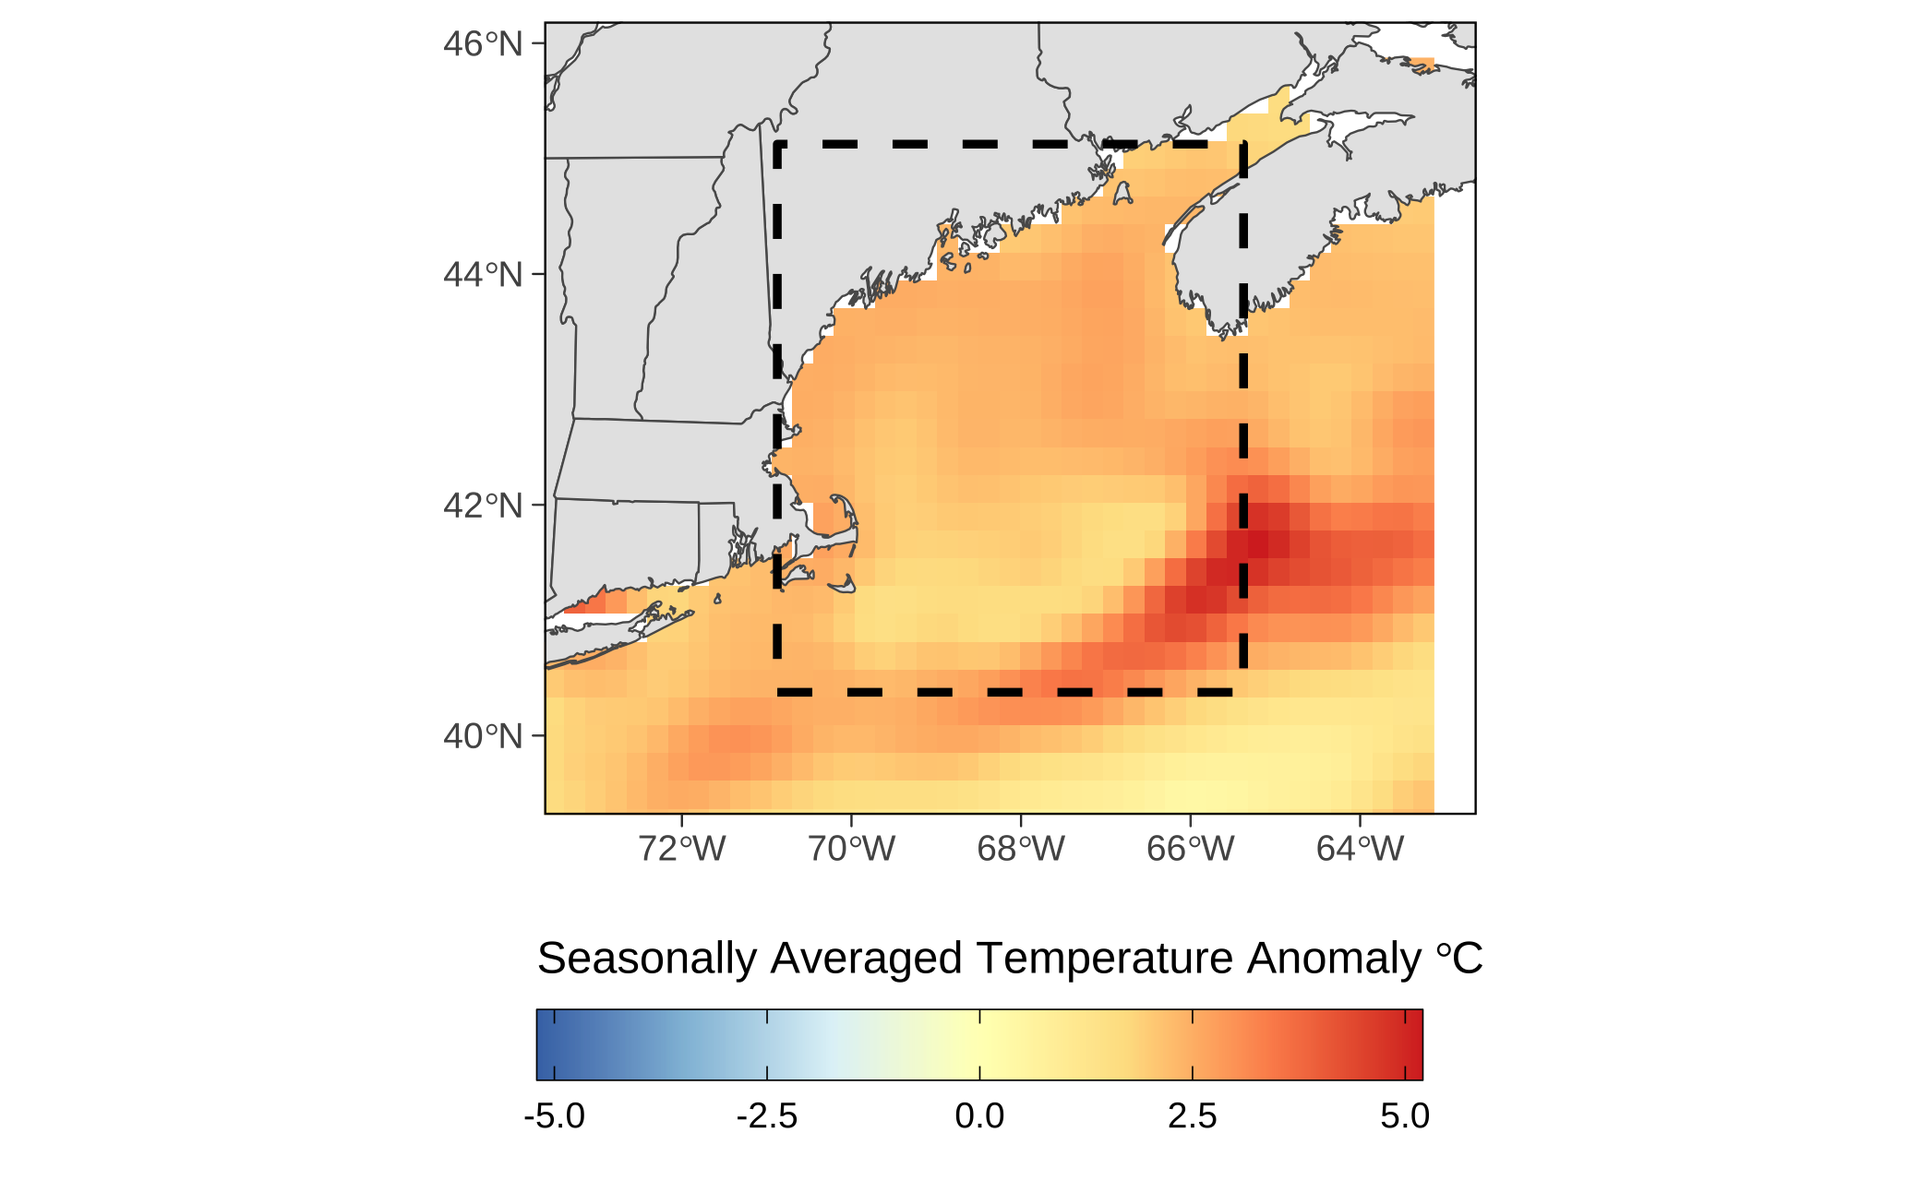
For analyses like this, it’s important to be clear about the spatial extent that “defines” the Gulf of Maine (Figure 1), as different borders could produce different numbers. It's also important to note where we are getting our data, which is derived from satellite measurements compiled by NOAA’s National Centers for Environmental Information.
Weekly Summer Temperature Anomalies
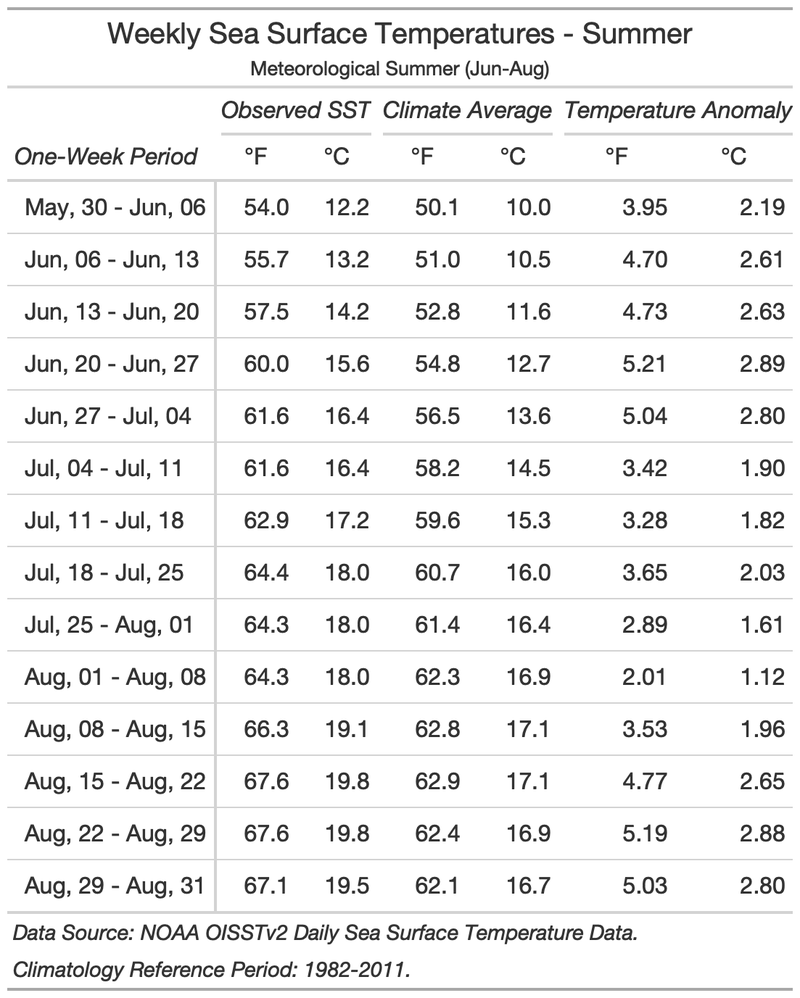
Knowing how hot or cold it was in the past gives us a baseline that we can compare with temperatures we observe today. In Table 1, we highlight how the surface ocean temperature for each week this summer (observed SST) compares to a 30-year baseline period (climate average) that spans from 1982 to 2011. The table shows the absolute values as well as the departures from that long-term average (temperature anomalies).
We can learn two important lessons by looking at data this way:
- The SST anomalies in July were lower than they were in June or August, meaning the month of July was relatively cooler (it was also significantly wetter).
- Even in that “cool” month of July, the Gulf of Maine was still close to 2°C warmer than normal (and almost 3°C warmer than normal for stretches in June and August).
Seasonal Trends & Anomalies
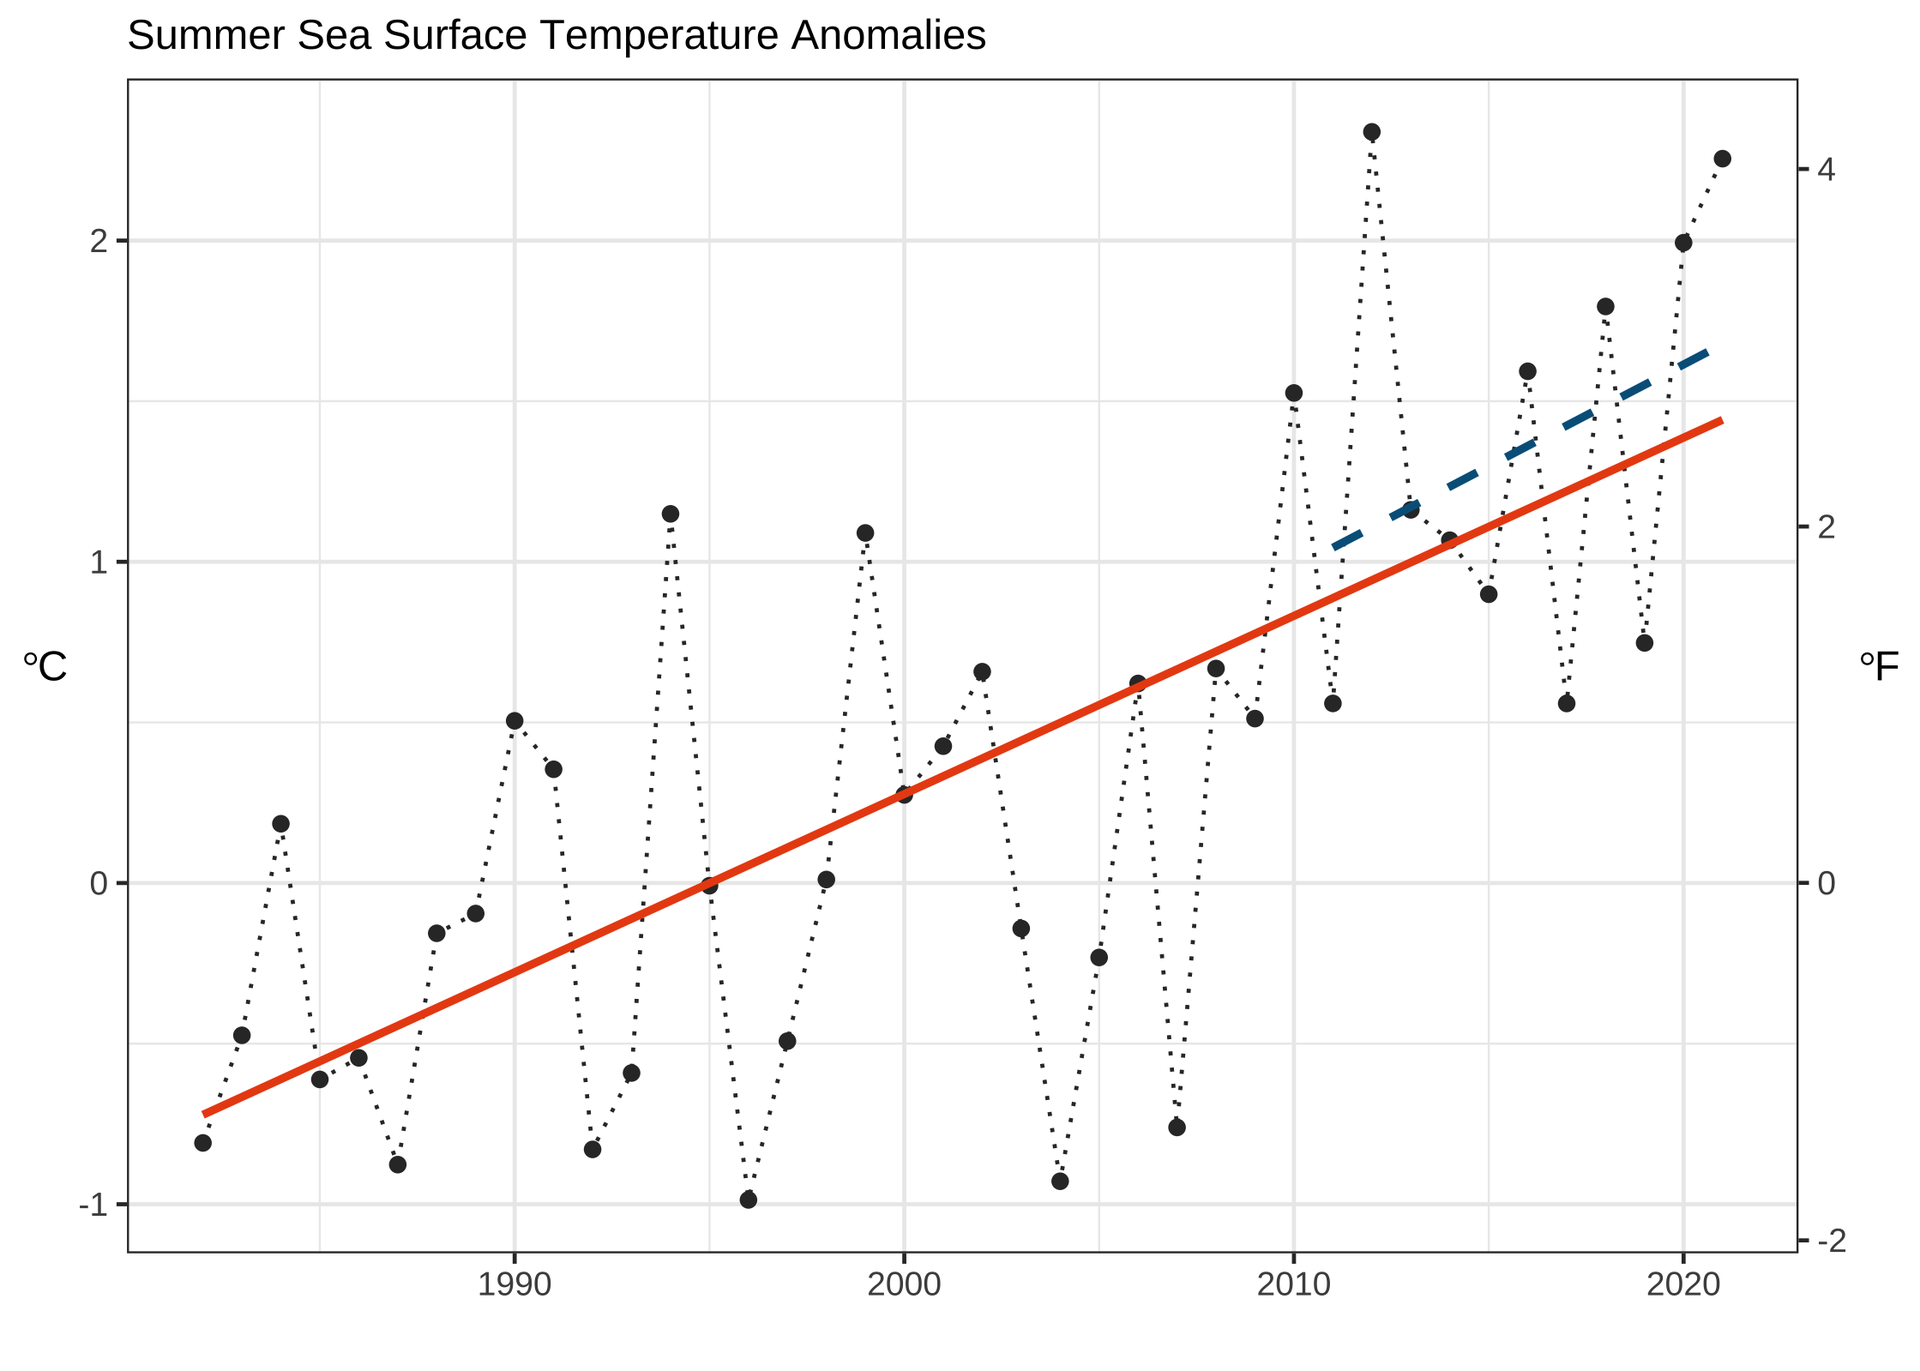
From 1982 to 2021, summertime SST in the Gulf of Maine has warmed at an average rate of 0.55°C per decade. For the last 10 years of this period (2011 – 2021), though, the average warming rate increased nearly 15% to 0.63°C per decade.
This period of faster warming is part of what appears to be a distinct regime in the Gulf of Maine. The drivers of this (e.g., a weakening of the Atlantic Meridional Overturning Circulation and shifts in the path of the Gulf Stream) have been well-documented in the peer-reviewed literature, including through research by GMRI scientists.
Since 2007, average summertime SST in the Gulf of Maine has not fallen below 15°C. Prior to 2007, average summertime SST in the Gulf of Maine only exceeded 15°C seven times in 25 years (1982 – 2007). In other words, temperatures this high were not the norm a couple decades ago, but they are now.
To put a finer point on it: summer 2021 was the second warmest summer in the Gulf of Maine on record (Figure 2).

When looking at the SST anomalies, we see that temperatures in the past decade have been 1 – 2 °C above what they previously were. Summer SST anomalies since 2008 have not fallen below 0.5°C, with 2012 remaining the hottest summer on record at 2.3°C above the 30-year seasonal average (Figure 3). This summer, the average anomaly was 2.26°C above the average.
Looking at this data from a spatial perspective (as opposed to temporal), we can see that the entire Gulf of Maine was unusually warm this summer, though there are regional differences. Particularly intense warm anomalies occurred off Georges Bank, and warm temperatures around Cape Cod also stand out relative to other portions of the Gulf of Maine.
Marine Heatwaves
Marine heatwaves (MHW) are defined as five or more consecutive heatwave days. To qualify as a heatwave day, the SST for that day must be higher than 90% of the same calendar days during the 30-year baseline period (1982 – 2011). Successive heatwaves with gaps of two days or less are considered part of the same heatwave, and not separated into distinct events.
Using this broadly accepted definition, the Gulf of Maine has experienced MHW conditions for almost all of 2021, with only brief reprieves in mid-March, late April, and during the transition from July to August (Figure 5). We started the year off with a MHW event in January that persisted through March. The longest heatwave of the year began at the very end of April, and lasted until the end of July, peaking at nearly 4°C above “normal” at the beginning of July and throughout the latter half of August.

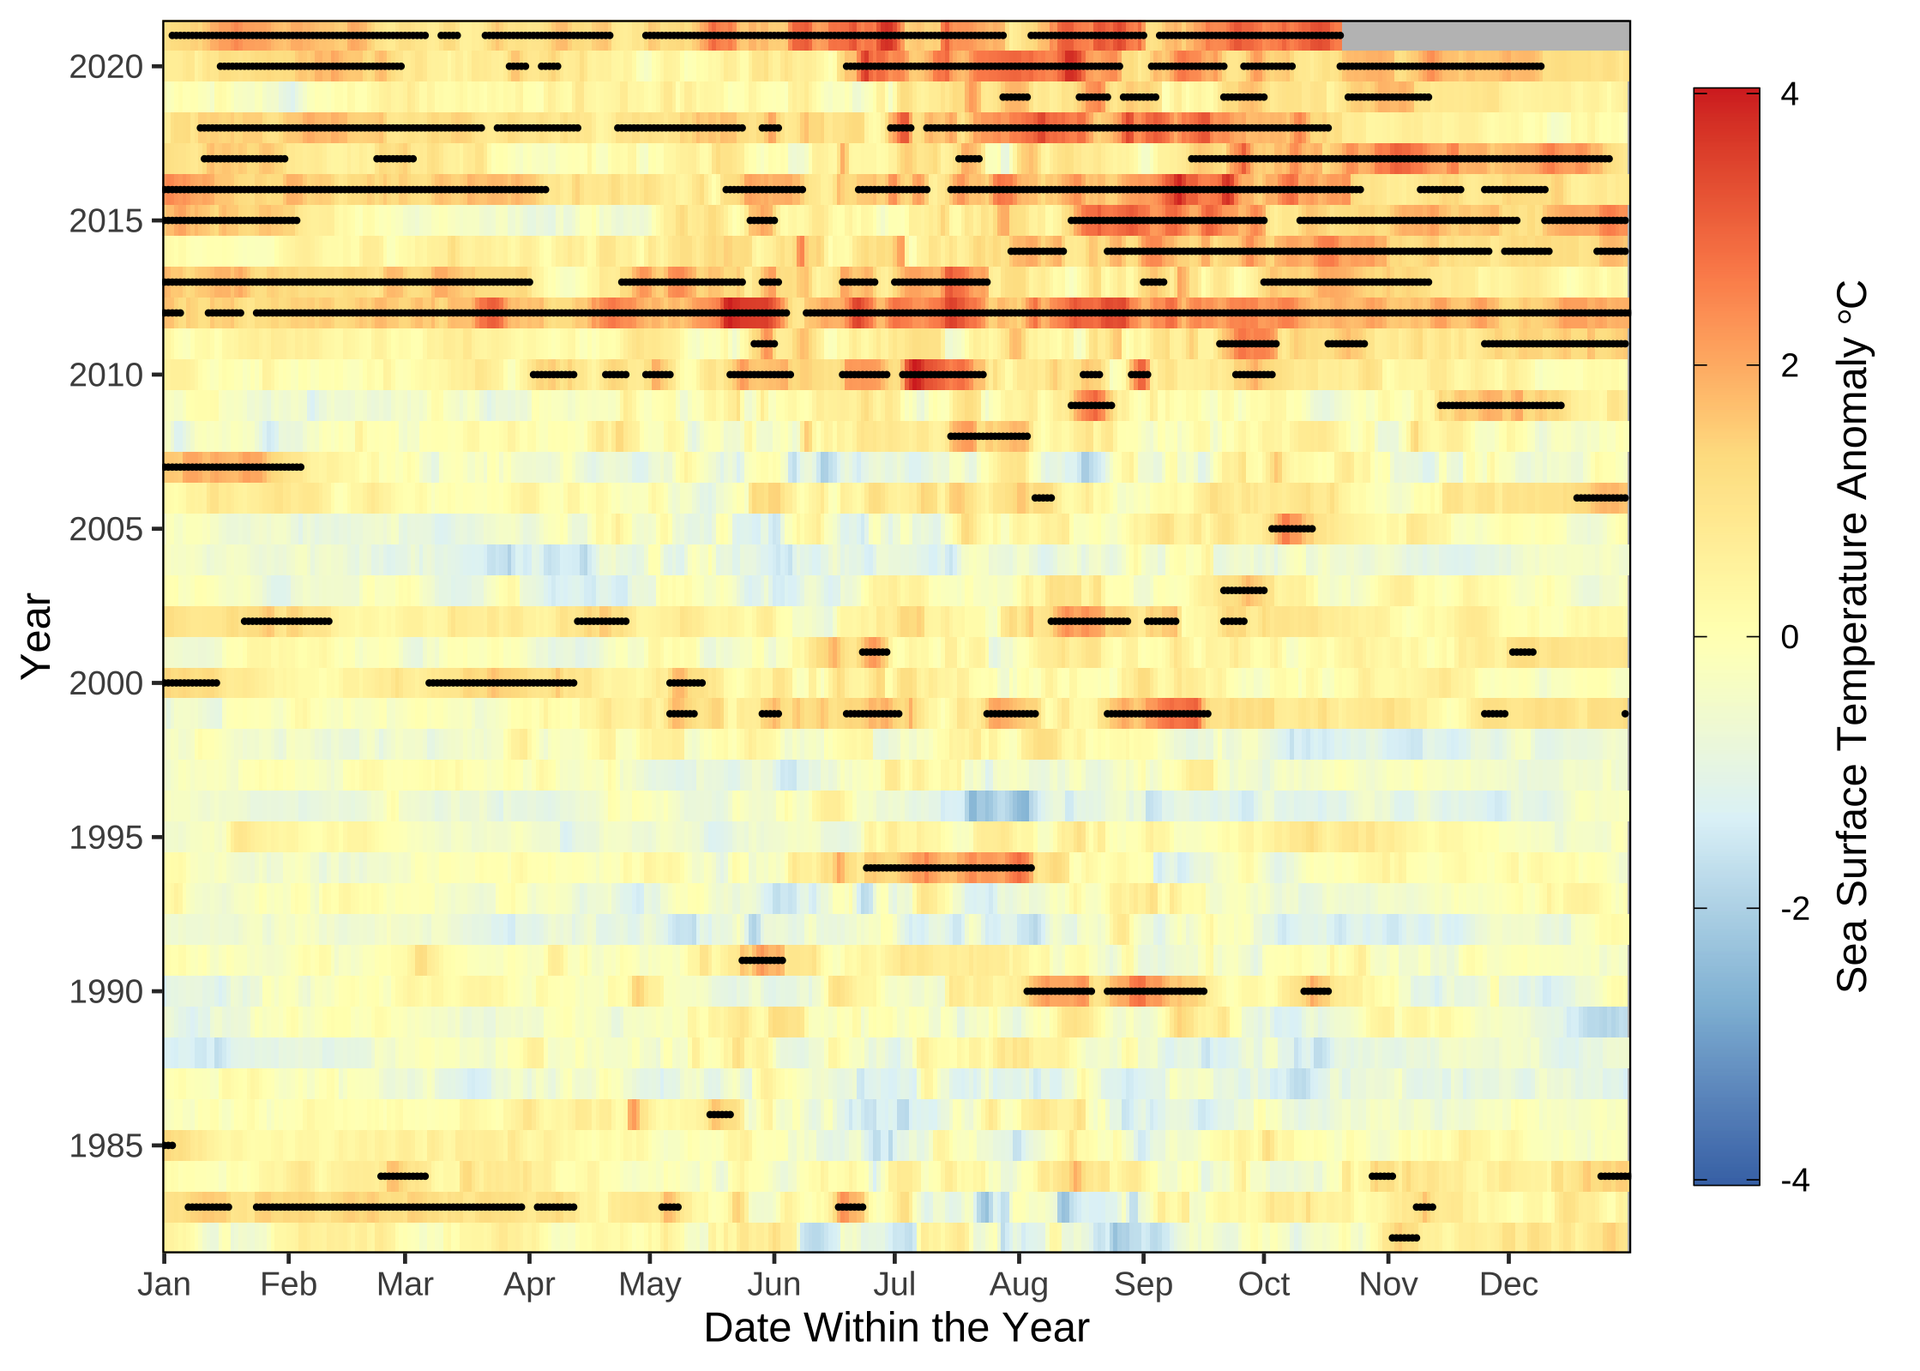
Perhaps a clearer way to see the progression away from the temperature regime of the 1980s and 1990s and into the warmer conditions in recent years, is through a heatmap plot (Figure 6). In this heatmap, each row represents a year and each day within the year is colored in accordance to how hot or cold it was relative to the 30-year baseline period. The increasing prevalence and darker shades of red in recent years highlight the persistence of exceptional deviance from the long-term average temperatures. The black lines illustrate MHW events, highlighting the increasing frequency of periods in heatwave conditions in recent years.
The Gulf of Maine in a Global Context
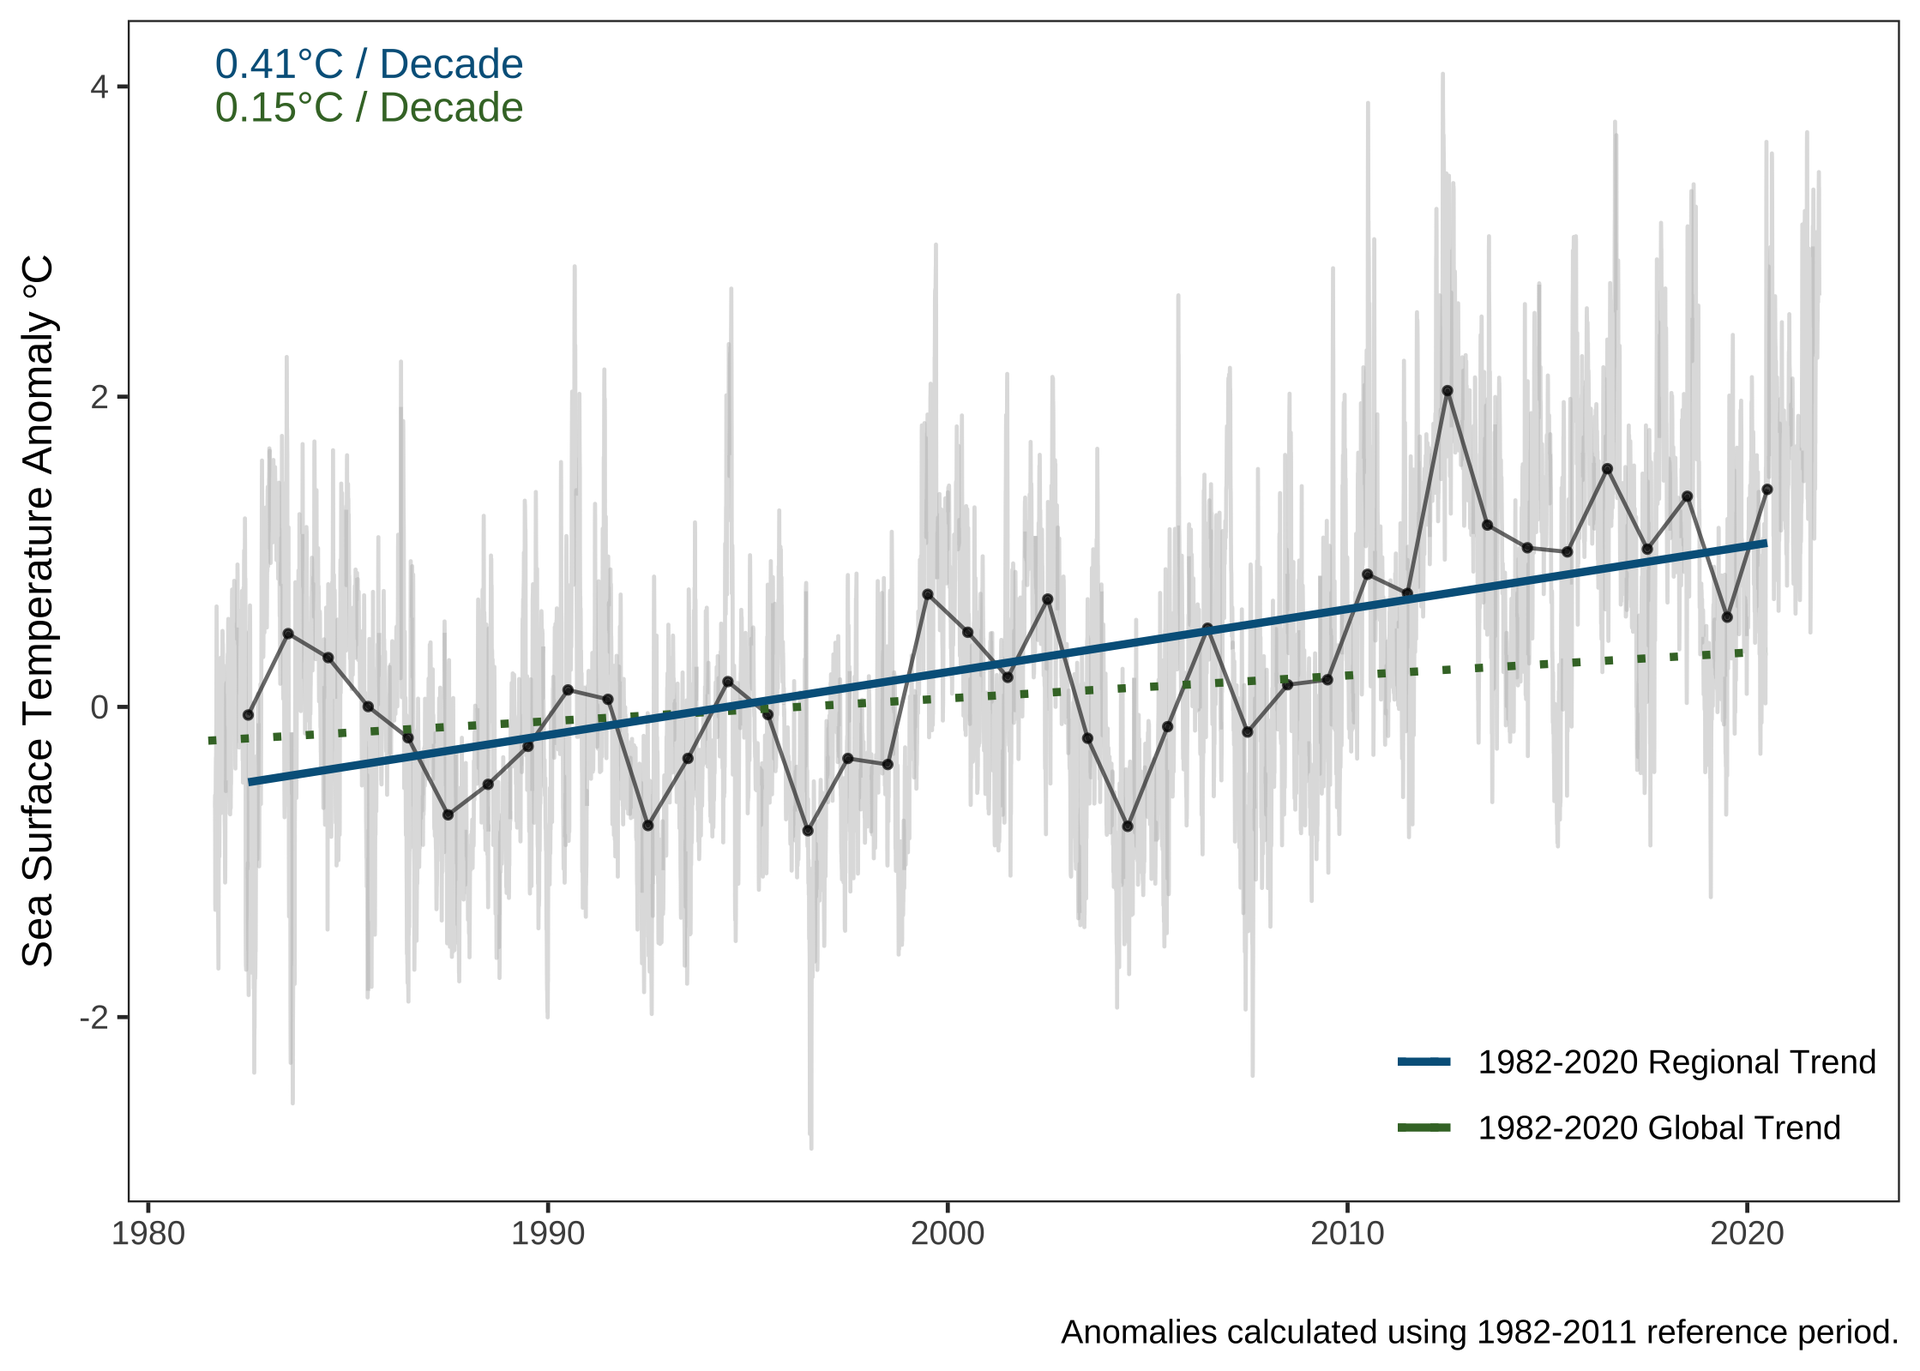
Zooming out a bit — in both space and time — we can compare the annual (as opposed to seasonal) trend in Gulf of Maine SST anomalies to the rest of the world. Doing so reveals that the Gulf of Maine anomaly has increased at a rate (0.41°C per decade) that is more than 2.5 times higher than the global average of 0.15°C per decade since the early 1980s (Figure 7).
If we look at the rates of change for each grid cell on Earth’s surface, rather than a plot of SST over time, it’s possible to rank how each location on Earth is warming relative to others. By ranking those warming rates, and then taking the average ranking across the Gulf of Maine, we can obtain the average warming rank for our area compared to the rest of the globe.
Prior GMRI research found that the Gulf of Maine had been warming at a faster rate than 99% of the world's oceans. This is still true when comparing warming rates across certain timescales, such as from 2004 to 2013 (when our initial warming study took place).
Over a longer reference period, from 1982 to 2021, the warming rate of the Gulf of Maine, as a whole (as defined in Figure 1) is still among the highest in the world — increasing at a rate of almost 0.05 °C per year, and faster than 96.2% of the world's oceans.
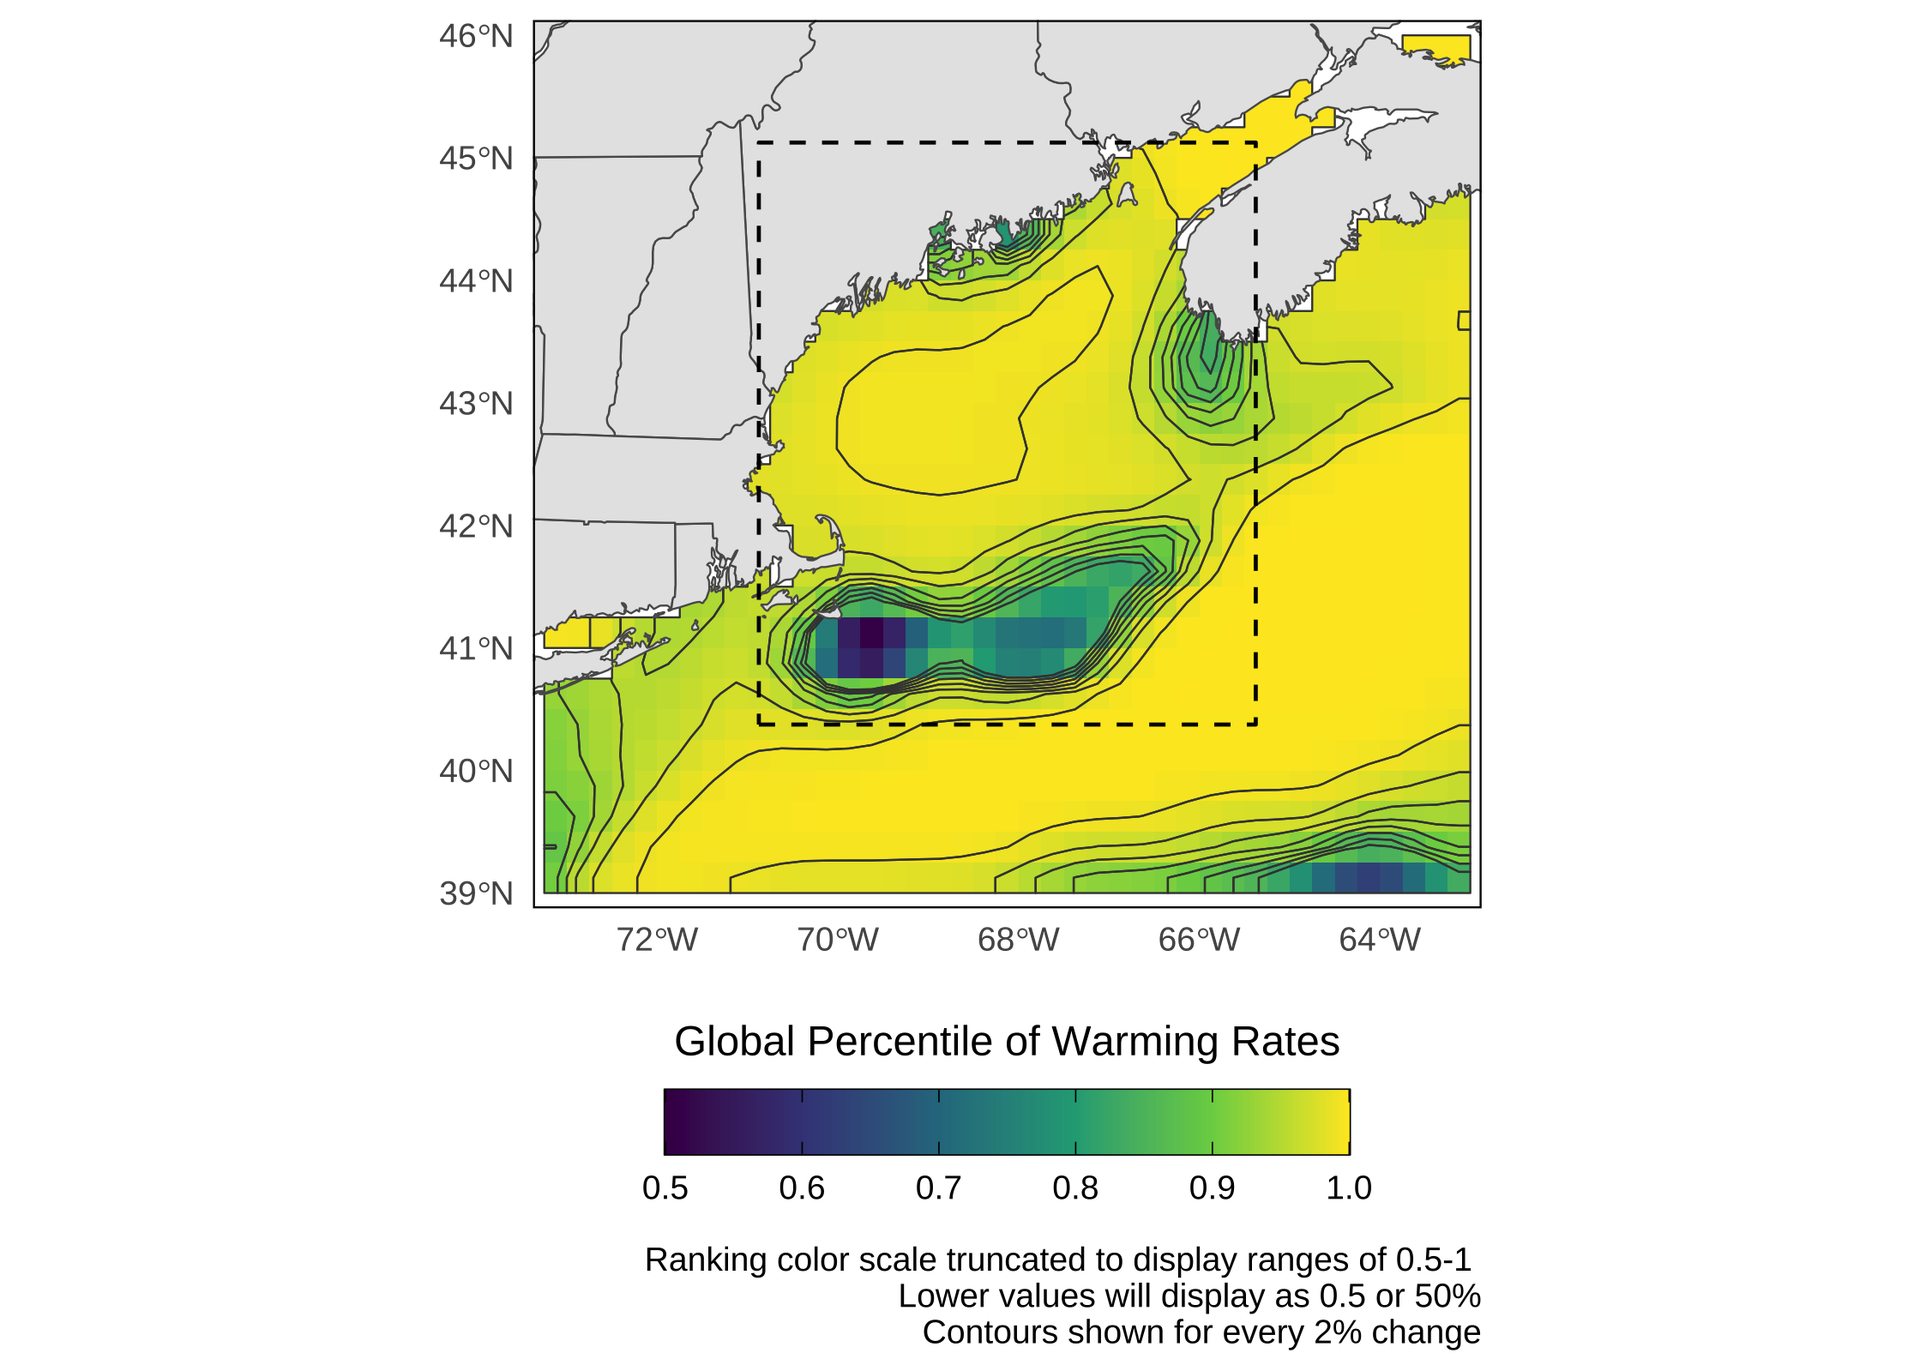
However, as Figure 8 illustrates, there can be significant spatial variability in this “ranked warming rate” across the Gulf of Maine. Warming rates across the region range from 0.014 °C per year to as high as 0.097 °C per year, meaning some locations over this longer timeframe are still warming faster than 99.5% of the world’s oceans.
This variability reflects the various physical oceanographic drivers influencing SST in the region, and in particular the significant interannual variability in the Gulf Stream’s influence on Georges Bank.
Word from the Water
We know that warming waters have real impacts on marine ecosystems, and are associated with widespread changes in the spatial distribution of species. Just over the course of the past year, we've received reports from people who have caught or seen species not typically spotted in our waters. Below are a few examples, including blue crabs, black sea bass, and even a smooth hammerhead shark.
""As ocean temperatures warm, species that are more commonly found south of Cape Cod are becoming more prevalent in the Gulf of Maine, where they can now find suitable temperatures. Also, as prey shift north as waters warm, their predators will follow."
Kathy Mills, Ph.D. Senior Scientist


For more information on other climate-related events, metrics, and trends in the Gulf of Maine region (both on land and the ocean), check out the Gulf of Maine Quarterly Update & Outlook compiled by the Northeast Regional Climate Center, which includes contributions from GMRI.