Monitoring Pollution with Mussels
Using mussels as environmental pollution indicators.
Marine ecosystems depend on healthy nutrient balances to thrive. When humans introduce excessive amounts of these nutrients through anthropogenic activities, these ecosystems can fall out of balance and collapse. Excessive nitrogen, in particular, can produce harmful algal blooms that lead to a host of other issues like shellfish toxicity, oxygen depletion, and coastal acidification. Traditional nitrogen monitoring methods can be costly and often fail to paint the whole picture. To construct more complete maps of human-associated nitrogen loading to our marine ecosystems, we measure nitrogen stable isotopes in mussels from numerous coastal sites. This is because mussels continuously filter food from the water, and in the process intake nitrogen that can be linked to humans or natural sources.
Project Goals:
- Construct maps of possible human-associated nitrogen loading to coastal marine ecosystems based on nitrogen isotope variations in mussels.
- Use mussel nitrogen isotope maps to inform more targeted nitrogen monitoring programs.
- Help decision-makers develop more robust and informed nitrogen loading mitigation strategies.
- Create a baseline for coastal nitrogen inputs to compare to future conditions.
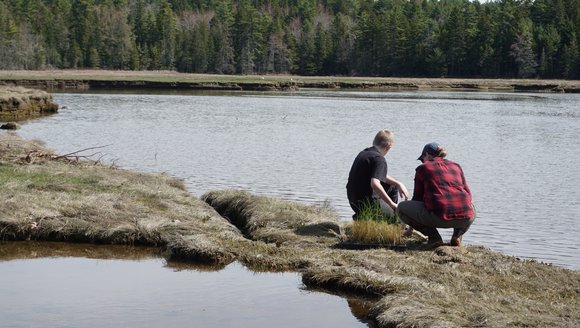
In 2018, we collected mussels from a total of 100 sites throughout Casco Bay and analyzed for nitrogen isotope ratios in their tissues to map out regions with higher levels of human-associated nitrogen (download the full report below for a more detailed explanation of nitrogen isotopes).

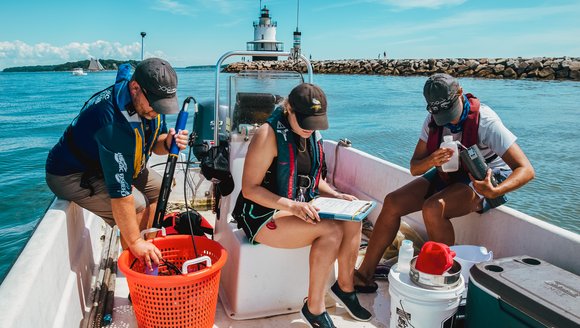
Green areas on the map indicate higher values of human-associated nitrogen (e.g., from sewage, septic, and livestock sources), whereas the blue regions represent values more consistent with natural nitrogen sources. Mussels are like continuous monitoring devices, as the nitrogen isotope values in their tissues may reflect weeks to months of average feeding conditions in one place. Other nitrogen monitoring activities may only provide temporal snapshots of nitrogen levels in just as wide of a geographic range. More traditional continuous monitoring methods use sophisticated sampling devices, or sondes, and are typically too costly to deploy over broad areas.
As of now, our nitrogen loading map doesn't necessarily indicate a nitrogen problem in any one location. Rather, our approach is intended to direct more targeted sampling strategies. We plan to repeat our sampling effort in Casco Bay in 2020 to reconstruct maps similar to those produced in 2018, but over longer periods of time. We will also expand sampling to Penobscot Bay to provide baseline data for any changes from land use practices in the area.

2018 Mussel Isotope Monitoring Report
In 2018, we collected mussels from a total of 100 sites throughout Casco Bay and analyzed for nitrogen isotope ratios in their tissues to map out regions with higher levels of human-associated nitrogen.
Project Team
Read Next
-
Sea State Recap: Developing the Blue Economy and Supporting Working Waterfronts
At our latest Sea State Seminar, we turned our attention to the people and places that keep Maine’s coastal economies alive. Framed by the theme …
Perspectives
-
2025 Research Progress Update
Each year, to keep you updated on our research team's progress, we develop an update showcasing some of our lab's achievements. More broadly, this update …
Reports
-
Sea State Recap: Adapting Fisheries & Seafood
In this installment of the Sea State series at the Gulf of Maine Research Institute (GMRI), we hosted a conversation about how collaboration and shared …
Perspectives
-
Community Science Wrapped 2025
Understanding how climate change is reshaping the Gulf of Maine, and New England at large, depends on steady, long-term observations — the kinds that reveal …
Perspectives