2025 Casco Bay Ecosystem Monitoring Report
Reports | Feb 12, 2026
Over the last several decades, we've seen dramatic ecosystem changes in the Gulf of Maine. We've observed population spikes and declines, habitat loss and recovery, and the appearance of new species that typically occur in regions to our south.
We are conducting long-term, nearshore monitoring to learn about the pace and direction of these changes in our region. Read on to dive into our key findings.

Report highlights
- Regional and local climate indicators suggested that sea surface temperatures were cooler than they have been in the last five years.
- Our ten most commonly caught species while beach seining were green crab, Atlantic silverside, winter flounder, mummichog, alewife, grubby sculpin, bluefish, Atlantic herring, American sand lance, and permit. Despite a record number of completed seines, overall fish abundance was at a time-series low.
- Catch indices of our three most commonly-encountered species — Atlantic herring, Atlantic silverside, and green crabs — collapsed to time-series lows.
- We encountered spot (Leiostomus xanthrus), a “southern species” usually found south of Cape Cod, for the first time.
- Catch of other southern species was reduced as compared to previous years. Notably, we did not encounter white mullet (Mugil curema), though we had noted increasing abundance of the species since 2020.
- We identified a potential link between green crab abundance and seasonal water temperatures likely to affect important moments in crab life history — overwintering survival of juveniles and growth or reproductive output of parent generations.
- Regional partners also noticed departures from recent trends in their long-term monitoring surveys, likely related to cooler temperatures. Wells National Estuarine Research Reserve scientists noted the absence of blue crabs (Callinectes sapidus) and “Gulf Stream Orphans.” They also reported a reduction in invasive tunicate presence and an associated increase in kelp health. Scientists at the Maine Department of Environmental Protection quantified a small increase in the biomass and distribution of Portland-area eelgrass beds.
The importance of nearshore monitoring
Casco Bay holds a rich cultural, economic, and ecological significance for our region. It is home to Portland, and includes over 200 islands (many of which are inhabited year-round by generations of Maine fishing families). The region is integral to Maine's identity as a hub for lobster fishing and contributes to the state's cultural image and traditions. In addition to supporting multiple fisheries and a growing aquaculture industry (shellfish and seaweed), Casco Bay serves as a prime location for tourism and recreational activities. Its tidal marshes, estuaries, and rocky shores support diverse marine life, while its wetlands and eelgrass beds contribute to carbon sequestration and nutrient cycling. The bay also acts as a natural buffer, protecting the coastline against storms and erosion.
The Gulf of Maine is warming faster than most of the world's oceans, driving major fishery changes and shifting species distributions that disrupt ecosystems. While remote observation methods track physical and some biological changes — such as temperature and chlorophyll levels via NASA satellites and buoy instruments — assessing higher trophic levels like fish relies on trawl surveys and fisheries landings, which focus offshore. Nearshore environments like Casco Bay remain largely unmonitored, leaving critical knowledge gaps about ecosystem shifts. Our nearshore monitoring efforts are essential to filling these gaps.
The Casco Bay Aquatic Systems Survey
The Casco Bay Aquatic Systems Survey (CBASS) is a long-term nearshore monitoring program we designed to fill this gap. Since 2014, we have been conducting a suite of on-the-water monitoring activities specifically designed to document, quantify, and predict ongoing and future ecological changes in the bay. These activities include monitoring river herring migration in the Presumpscot River, conducting hook-and-line surveys for groundfish in the outer portion of the bay to the West Cod ledges (~2 – 5 miles offshore), and completing acoustic surveys designed to understand changes in mussel populations.
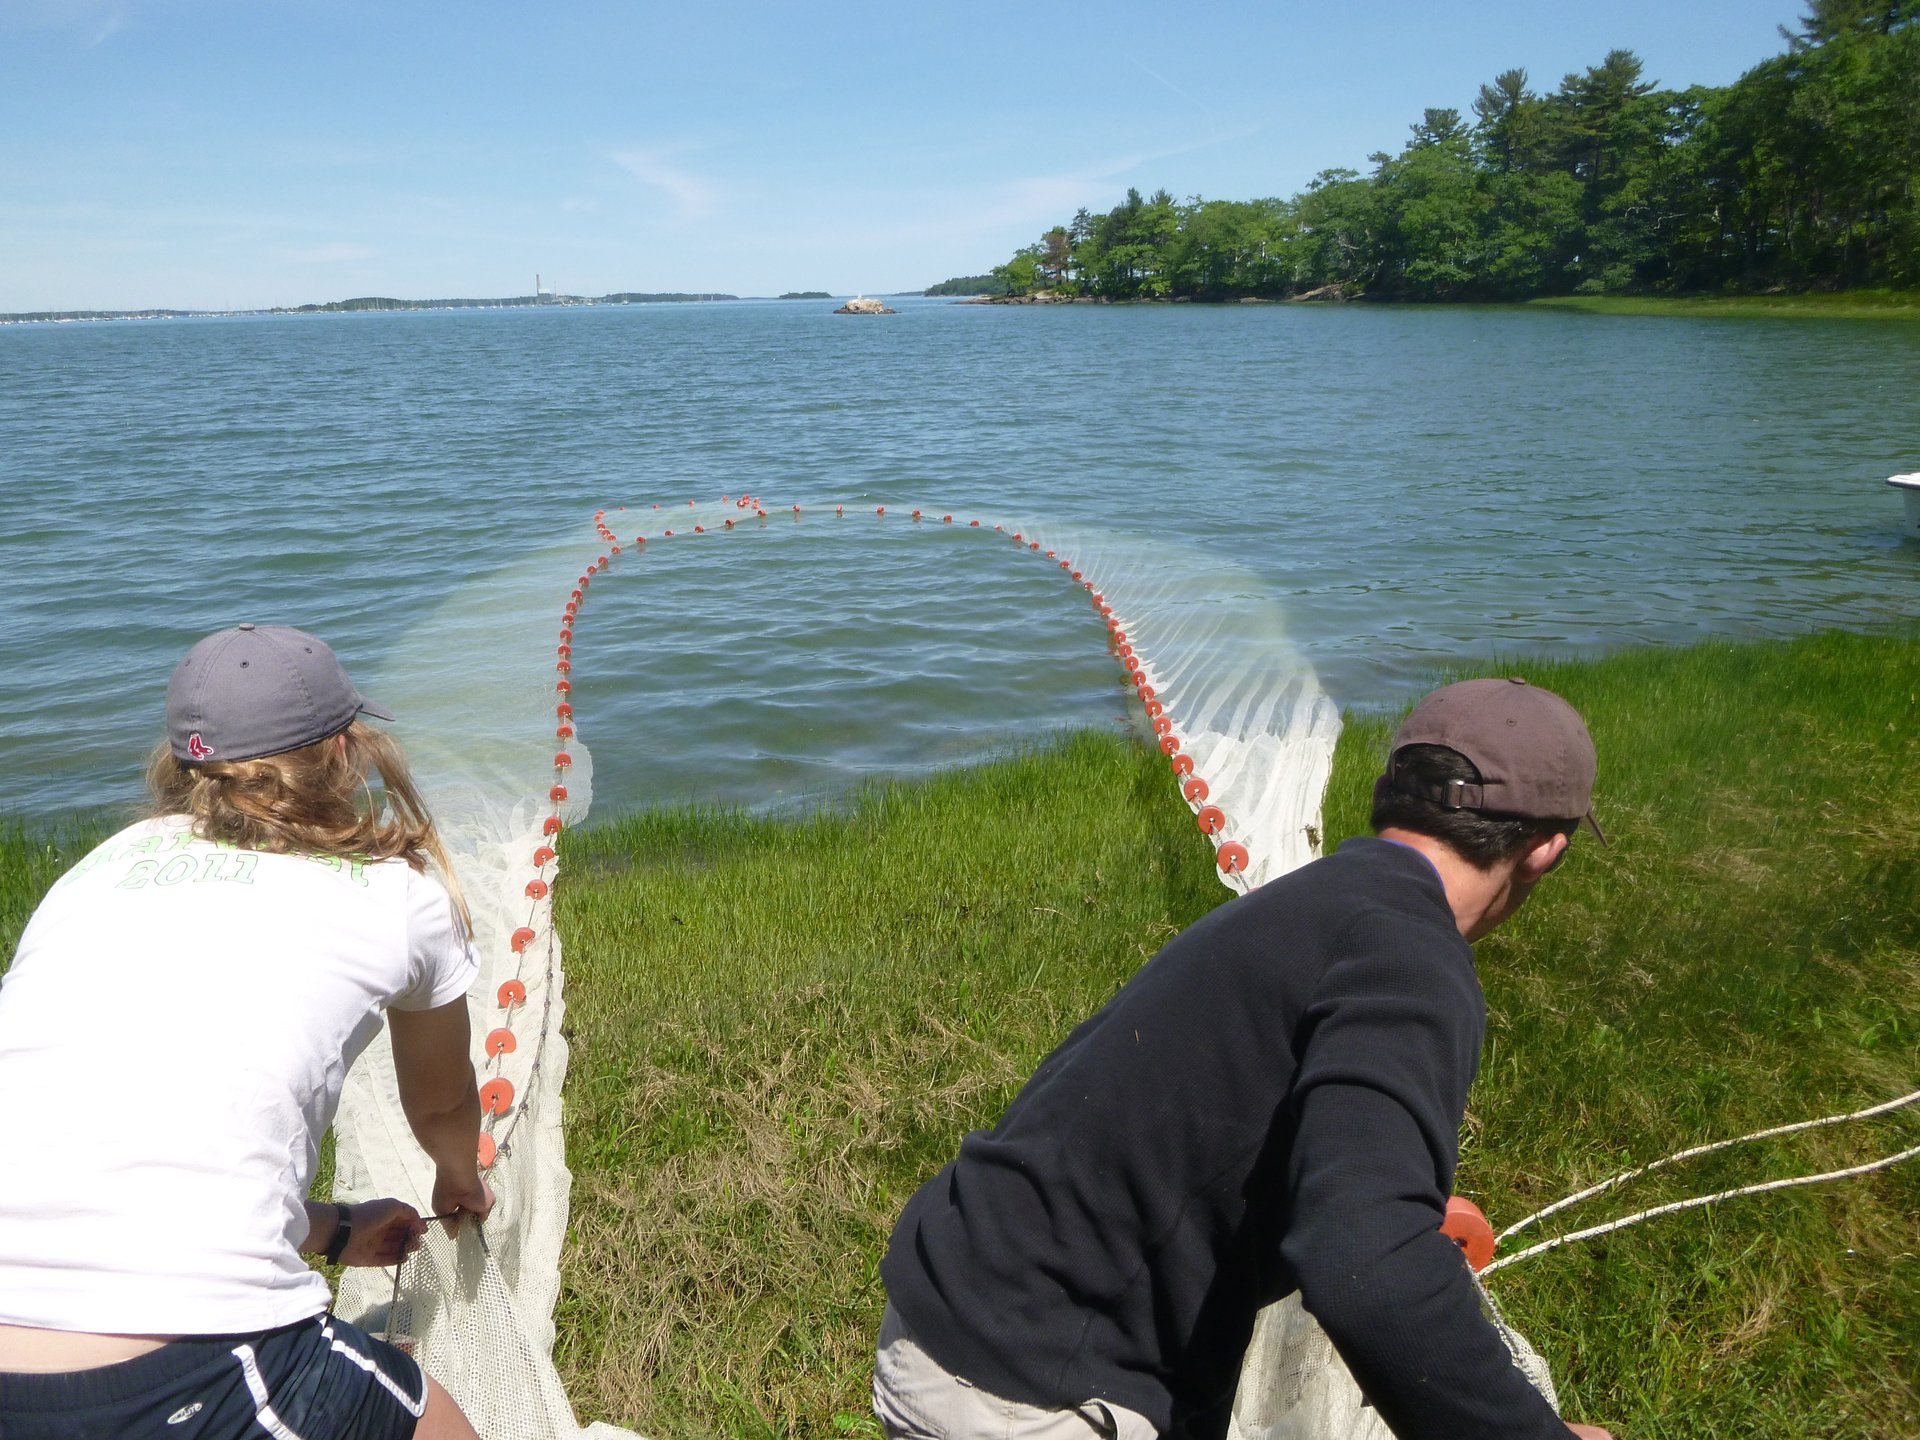
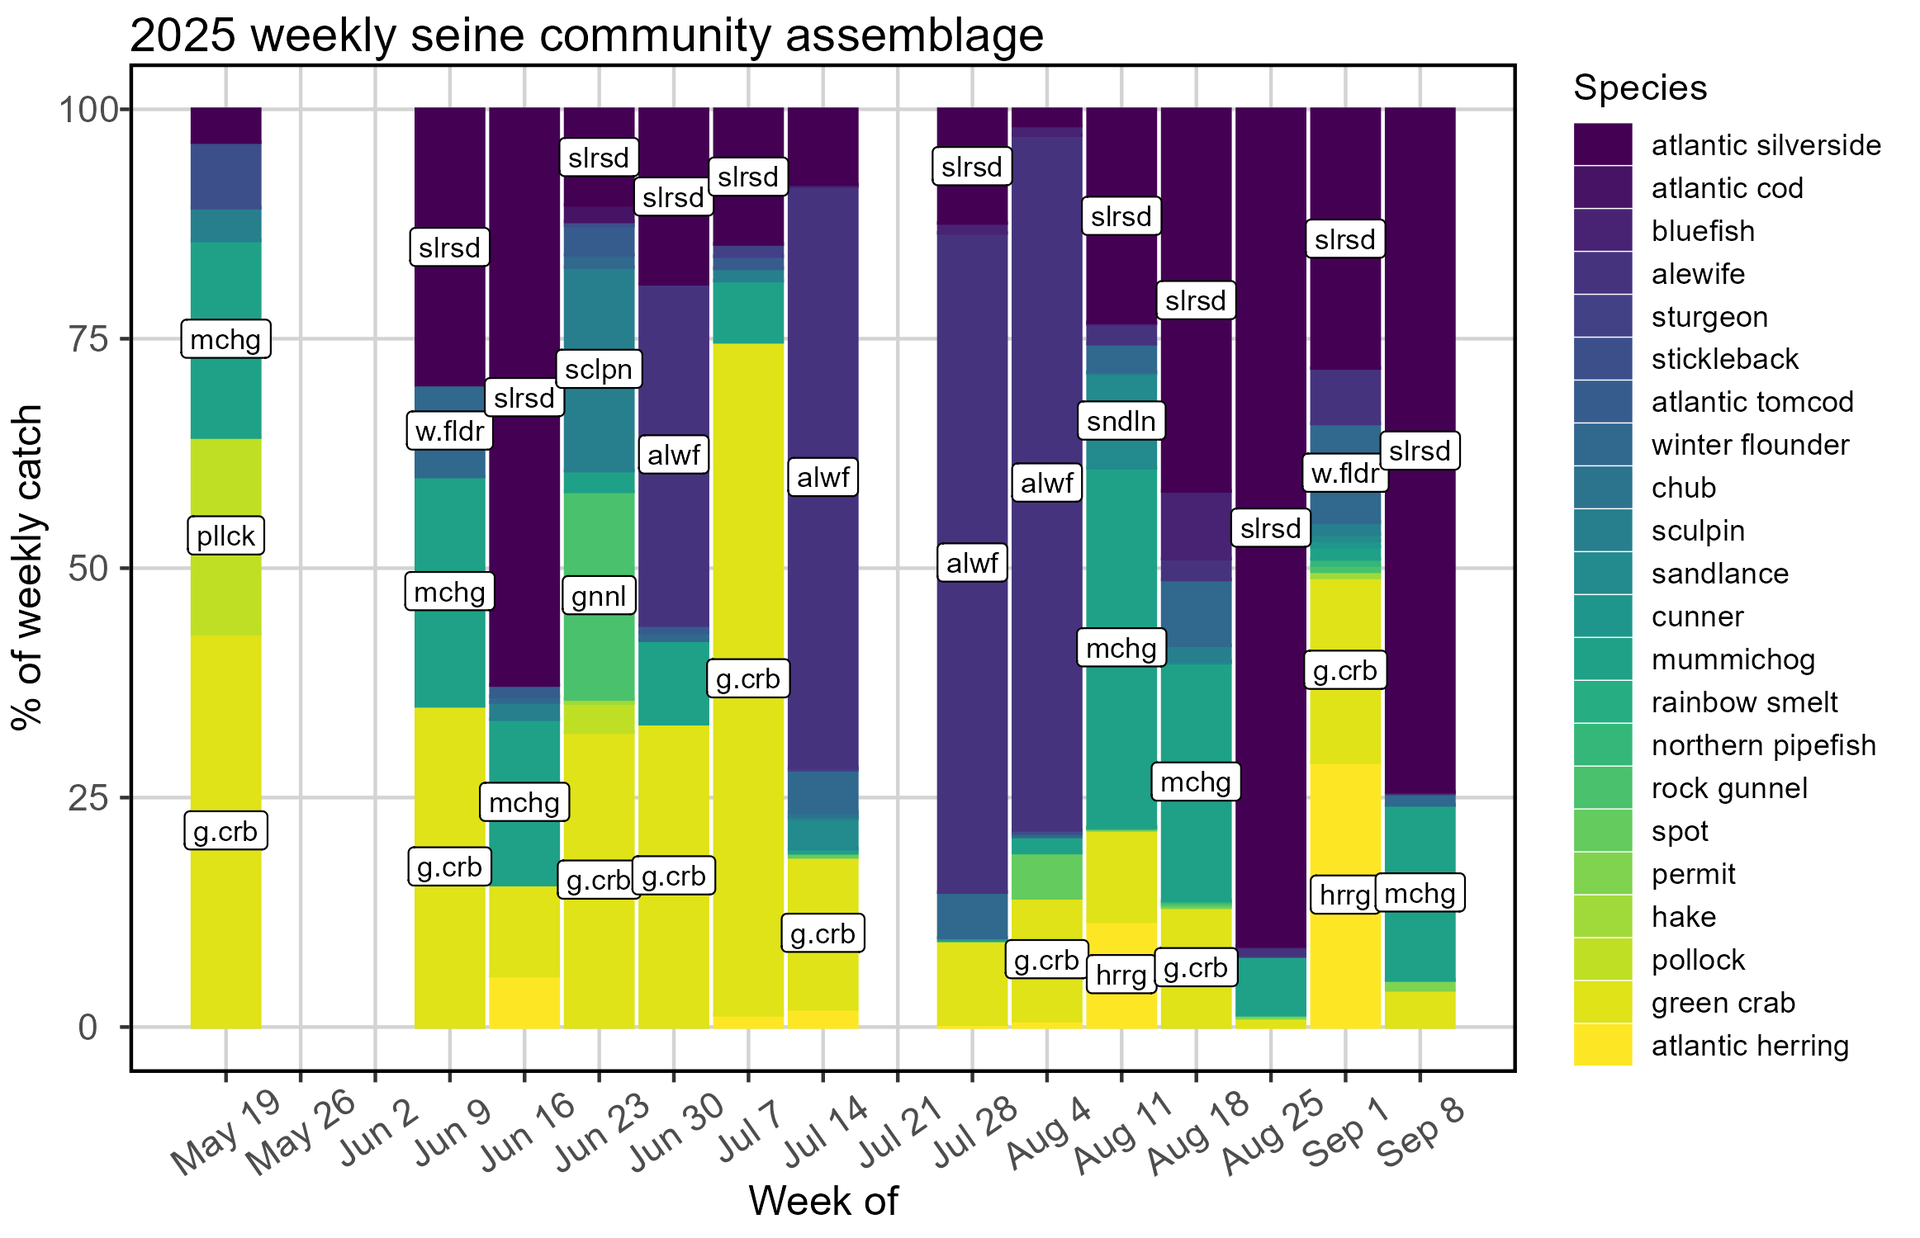
The cornerstone of CBASS is a beach seine survey designed to track changes in the abundance and habitat use of common nearshore species like juvenile Atlantic herring, alewife, sand lance, silverside, mummichog, and winter flounder.
Survey sites in the western end of the bay run from the mouth of the Presumpscot River to beyond Portland Head Light — all within swimming distance from shore. Starting in 2023, we added beach seine survey sites along the peninsulas and islands of Harpswell in the eastern end of the bay. Weekly abundance data, combined with temperature data, may reveal how warming waters impact the overall composition of nearshore ecosystems.
Finally, our monitoring efforts allow us to track the arrival of southern species that may represent the leading edge of a species reorganization in southern Maine waters, which could have unknown ecological consequences. While not part of our formal monitoring activities, we also have close contacts in the fishing industry who observe daily ecosystem conditions.
In Partnership with Quahog Bay Conservancy
This work is completed in collaboration with Quahog Bay Conservancy, a partner organization that shares our mission to use community-held knowledge and scientific research to deepen our understanding of ecosystems within the Gulf of Maine and beyond. The partnership also provides an important opportunity to ground-truth emerging observations in the field. By comparing data and experiences across organizations and locations, we can better determine whether unusual patterns — such as the delayed appearance of fish this summer — reflect broader ecological shifts rather than sampling error. This shared approach strengthens confidence in what we are seeing and helps ensure that local observations contribute to a more comprehensive understanding of change across the region.
Physical Context
Gulf Stream position
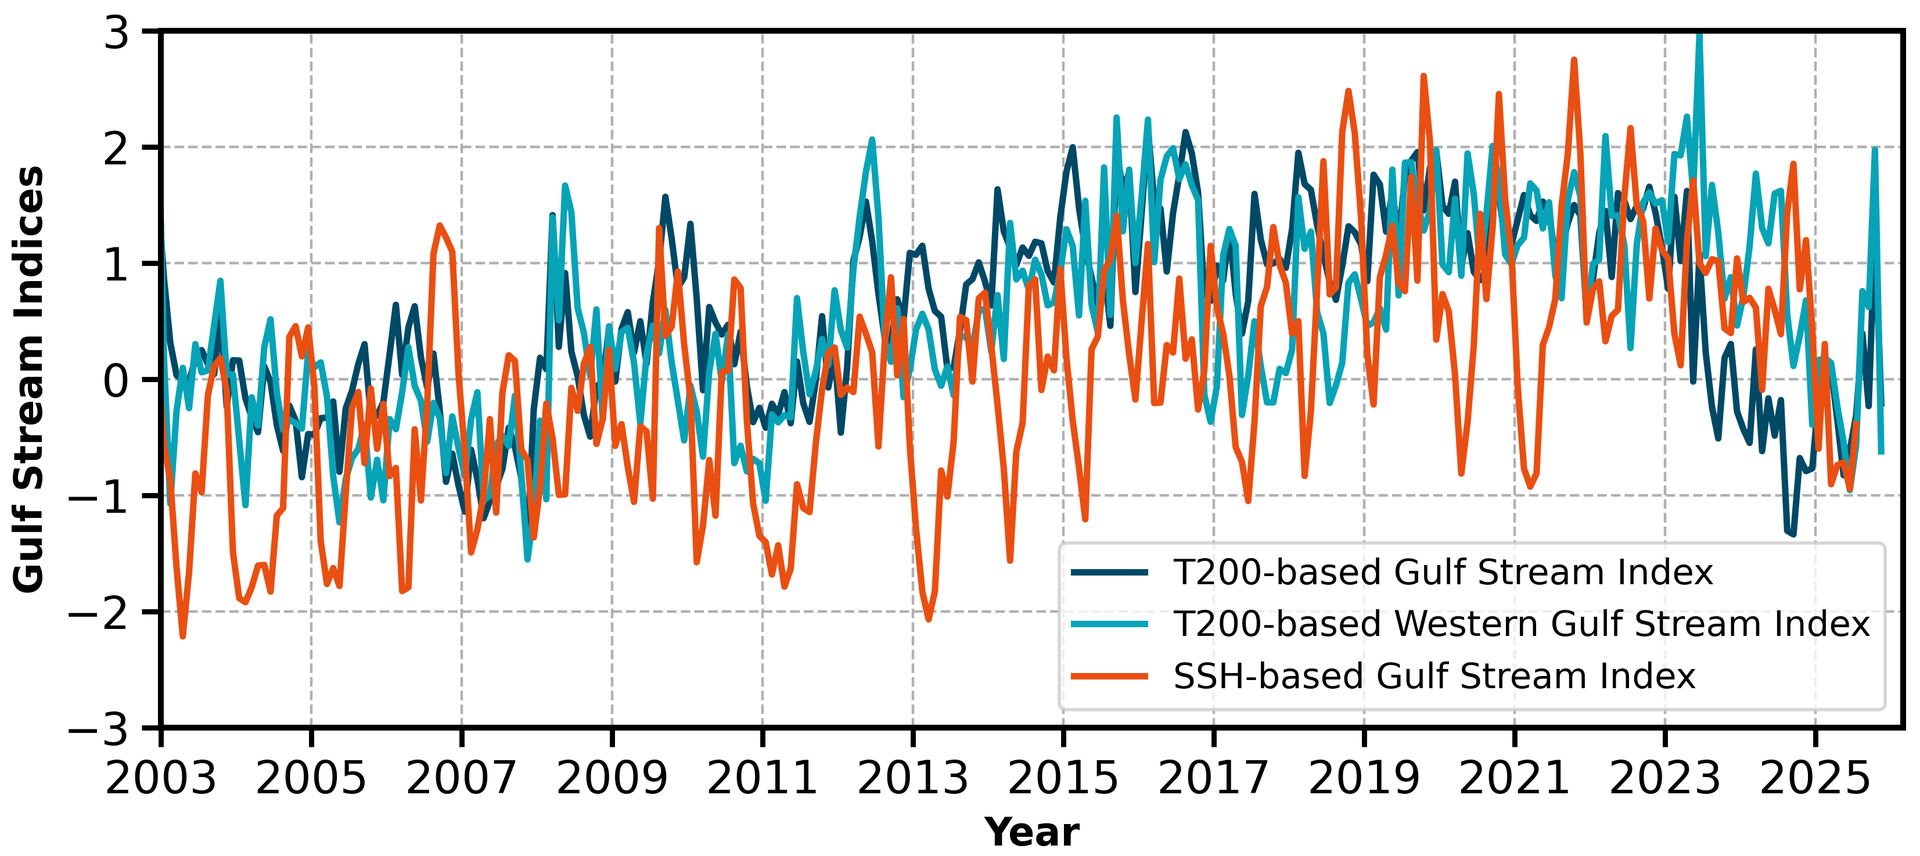
The Gulf Stream is a powerful ocean current that carries warm, salty water from the tropics up along the U.S. East Coast and out into the North Atlantic. It’s part of a larger system of ocean circulation that helps move heat around the planet and shape regional climate. When the Gulf Stream shifts north or south, it can change water temperatures and currents off the Northeast U.S., including in the waters between the deep ocean and the continental shelf. Those changes can ripple through marine ecosystems and affect species like plankton and young fish that drift with the currents.
To track these shifts, we looked at several commonly used measures of the Gulf Stream’s position based on ocean temperature and satellite observations. From 2003 through the early 2020s, these measures show the Gulf Stream moving north and south from year to year and over longer periods. Starting in the mid-2010s, the current tended to sit farther north than usual for several years. In 2025, however, the available data suggest more mixed and variable conditions, with the Gulf Stream closer to its average position and occasionally shifting south. While the full year of data isn’t yet available, this change could influence ocean temperatures and currents in nearby waters, including along the Northeast U.S. shelf.
Local temperature anomalies
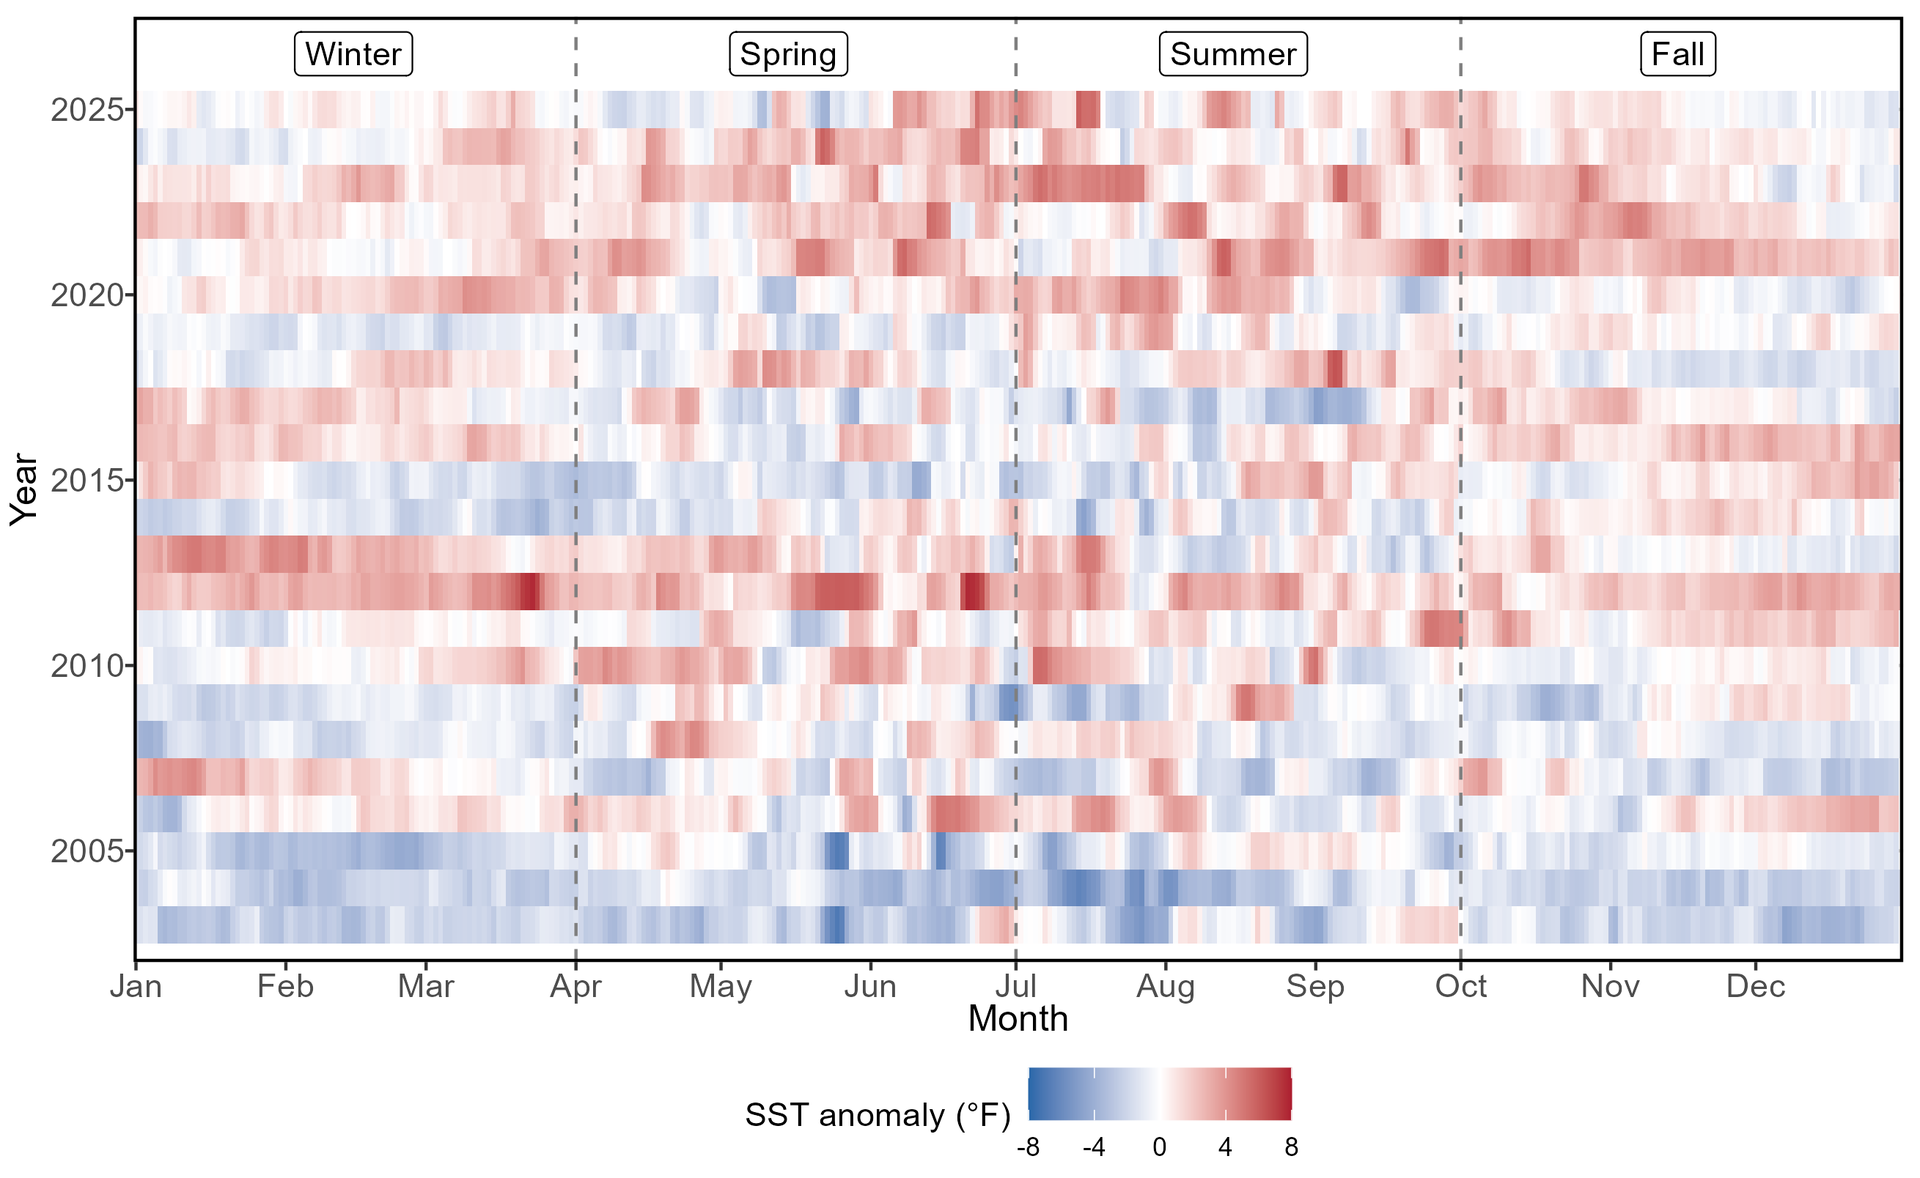
Seasonal patterns of water temperature are linked to the growth, reproduction, and movement behaviors of aquatic organisms. Deviations from average temperature patterns over time and space may affect the population sizes and distributions of these organisms. Comparing the timing and duration of important seasonal temperature events, like spring warming and summer highs, can provide critical context to assess changes in nearshore ecosystems.
The GMRI Warming Update series reports temperature anomalies for the entire Gulf of Maine. Here, we repeat this process for Casco Bay, taking advantage of NASA’s Multi-scale Ultra-high Resolution (MUR) sea surface temperature (SST) analyses. This product uses data from multiple satellite-based instruments to create consistent daily maps of SST at the highest possible spatial resolution, which allows for the analysis of temperature records within nearshore environments not surveyed in coarser-spatial-scale products. Our previous approach used only temperature records from a single representative point in nearshore Casco Bay, NOAA's Portland Harbor tide gauge. The new approach can synthesize surface temperatures from almost the entire surface area of Casco Bay, allowing for a more holistic view of conditions experienced by the organisms we encounter in our seine surveys.
Seasonal patterns of water temperature are linked to the growth, reproduction, and movements of aquatic organisms. Deviations from average temperature patterns over time and space may affect the population sizes and distributions of these organisms. Comparing the timing and duration of important seasonal temperature events, like spring warming and summer highs, can provide critical context to assess changes in nearshore ecosystems.een anomalously cool and anomalously warm conditions in May. By early June, sea surface temperatures were consistently warming. A few brief periods of anomalously cool temperatures in late July through the end of August broke up the summer, which was 1.4°F warmer than average. Fall temperatures were also 0.3°F warmer than average and may impact community composition next summer.s
Species of Note
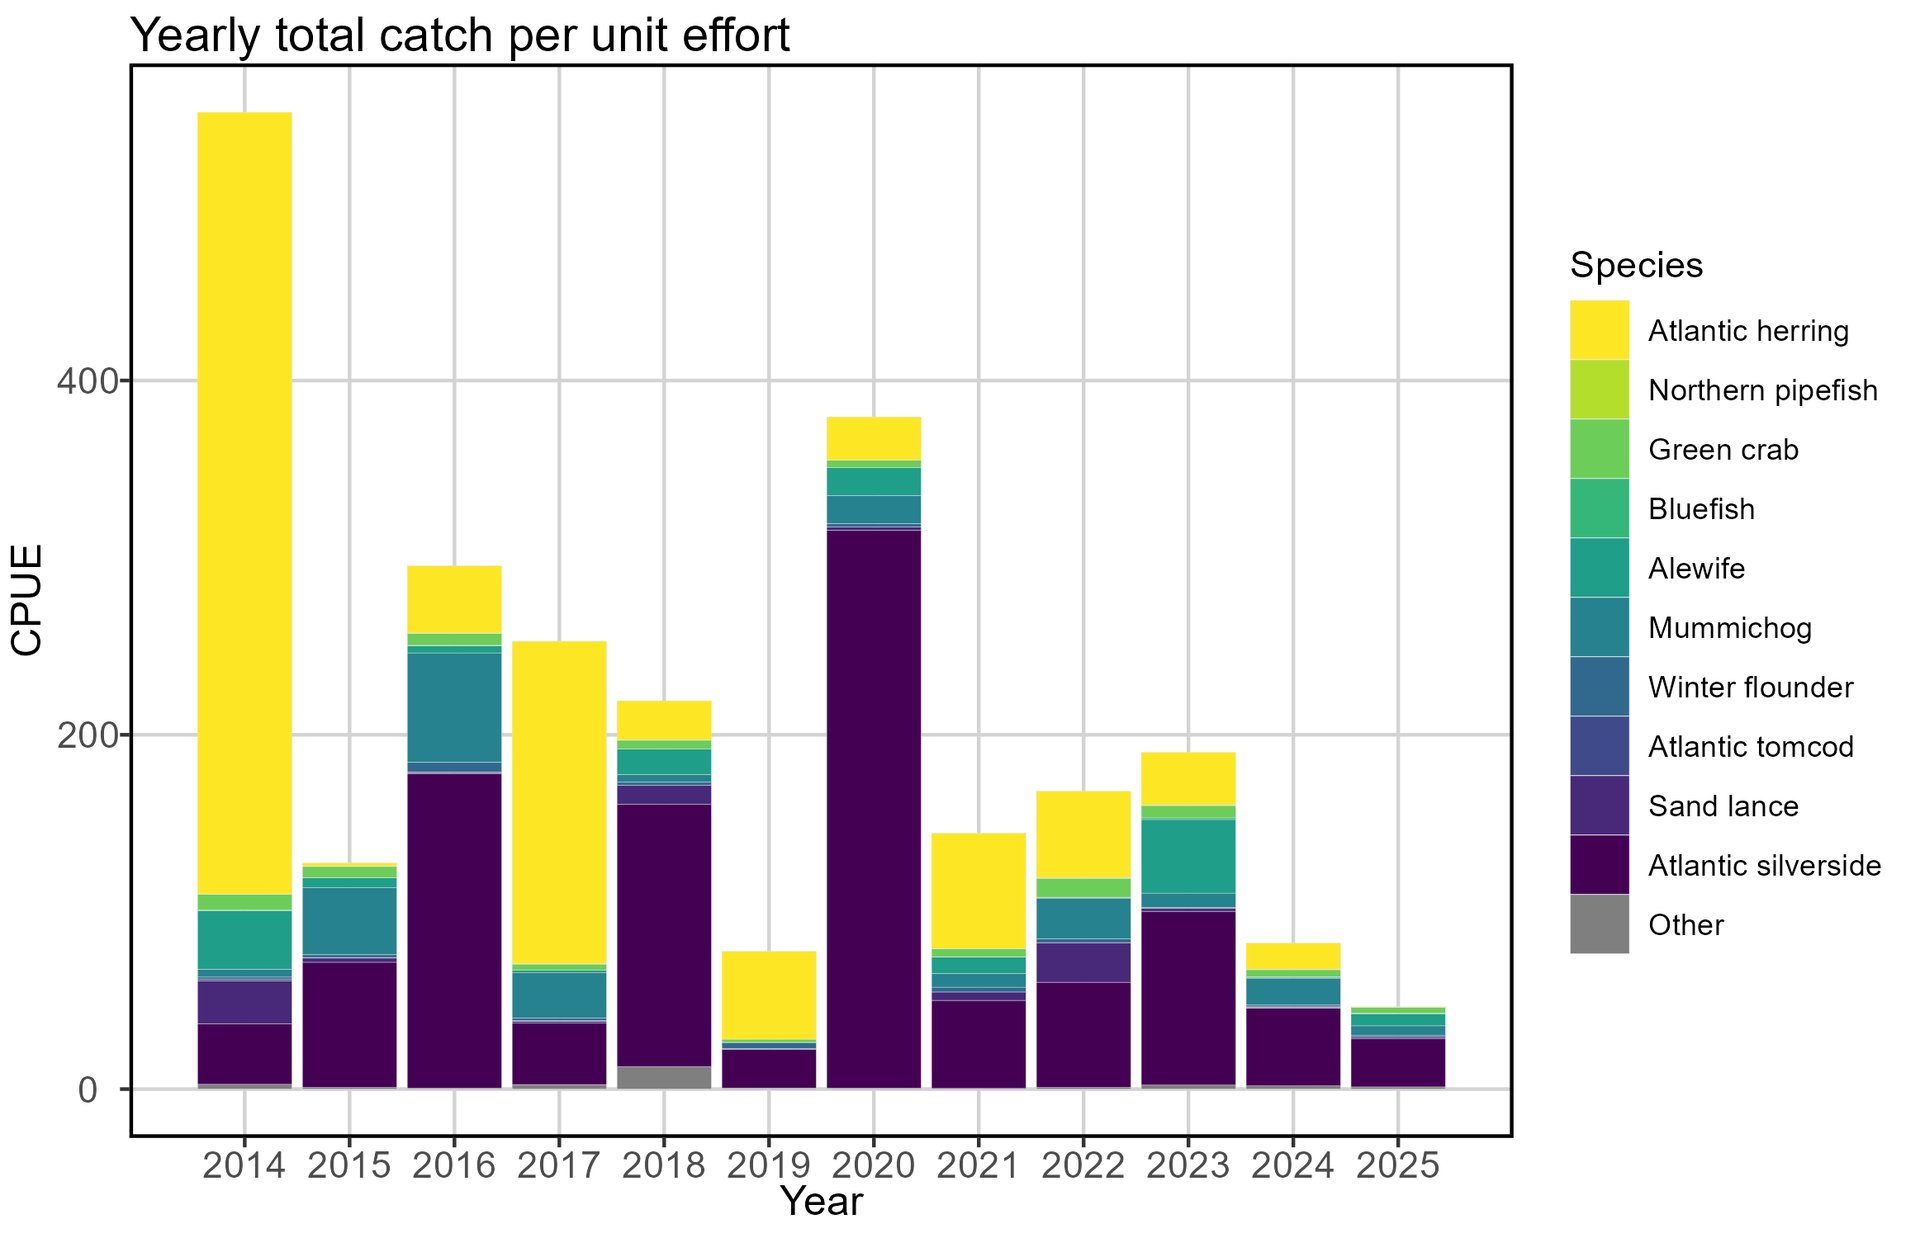
Beach seine data indicated that the Casco Bay nearshore fish community assemblage in 2025 was significantly different from the previous eleven years. Despite a record number of completed seines, the combined catch of all species was at a time-series low. Our ten most commonly caught species were:
- Green crab (Carcinus maenas)
- Atlantic silverside (Menidia menidia)
- Winter flounder (Pseudopleuronectes americanus)
- Mummichog (Fundulus heteroclitus)
- Alewife (Alosa pseudoharengus)
- Grubby sculpin (Myoxocephalus aenaeus)
- Bluefish (Pomatomus saltatrix)
- Atlantic herring (Clupea harengus)
- American sand lance (Ammodytes americanus)
- Permit (Trachinotus falcatus)
The overall low catch was driven by a record low catch-per-unit-effort (CPUE; number of fish caught divided by number of seines completed) within our time series for Atlantic silverside, Atlantic herring, and green crabs. These three species are historically among the most abundant in the beach seines. CPUE for other common species — Atlantic tomcod, mummichog, northern pipefish, sand lance, and winter flounder — was also among the lowest on record.
We observed spot (Leiostomus xanthrus) for the first time, and consistently caught the species at one sampling site throughout July and August. Though spot are occasionally distributed north of Cape Cod, they are mostly concentrated and better known in the Gulf Coast, Southeast Atlantic, and Mid-Atlantic regions. Also notable was a small catch of juvenile Atlantic cod (Gadus morhua), which had not been observed in the seine survey since 2014.
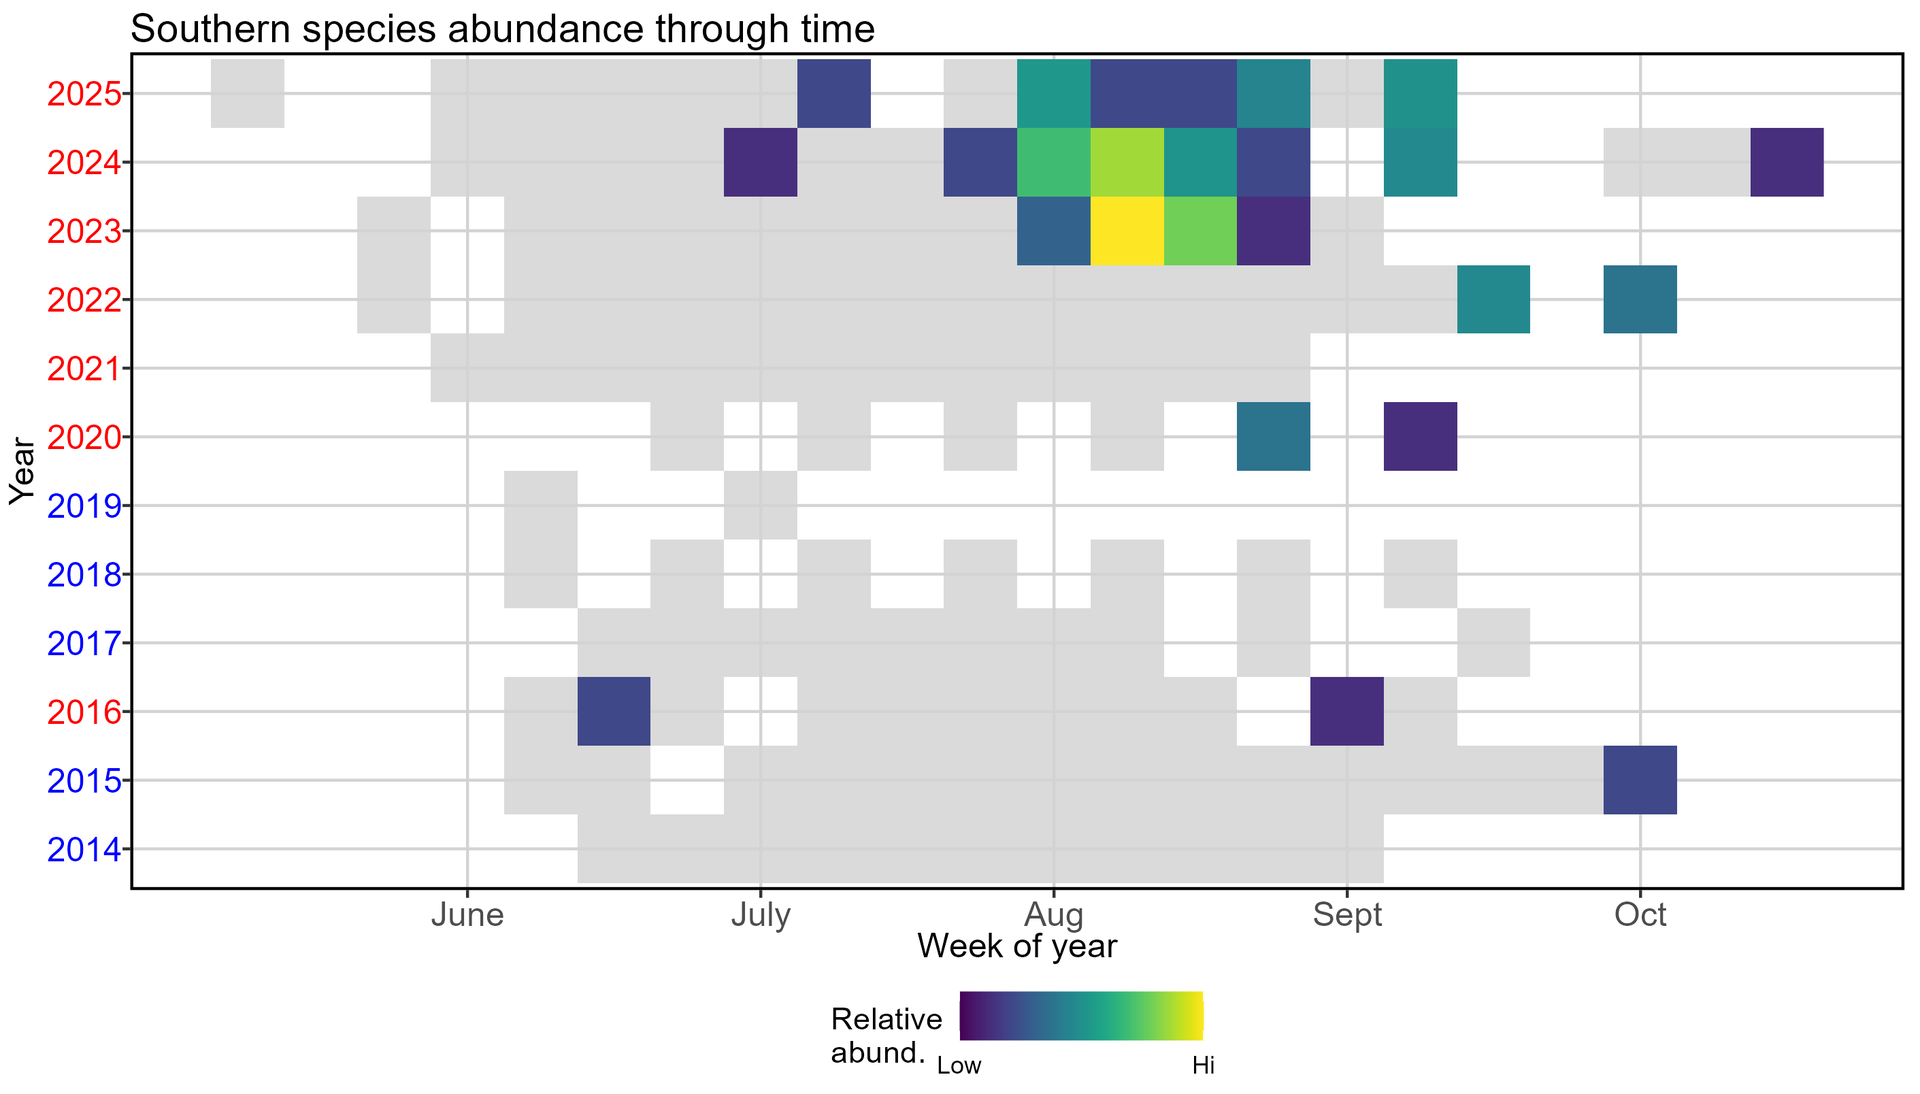
Southern species
Since 2022, we have regularly caught an array of “southern species,” which are fishes more commonly found south of Cape Cod than in the Gulf of Maine. Some of these fishes are tropical or subtropical species colloquially known as Gulf Stream Orphans (GSOs), because they are swept into the Gulf of Maine by the Gulf Stream Current as larvae or juveniles and will not survive harsh North Atlantic winters. Our yearly catch of southern species usually includes crevalle jack (Caranx hippos), permit, and white mullet (Mugil curema). This year, our overall catch of southern species was low and only included permit and spot.
Emergent Trends
Green crabs and winter temperatures
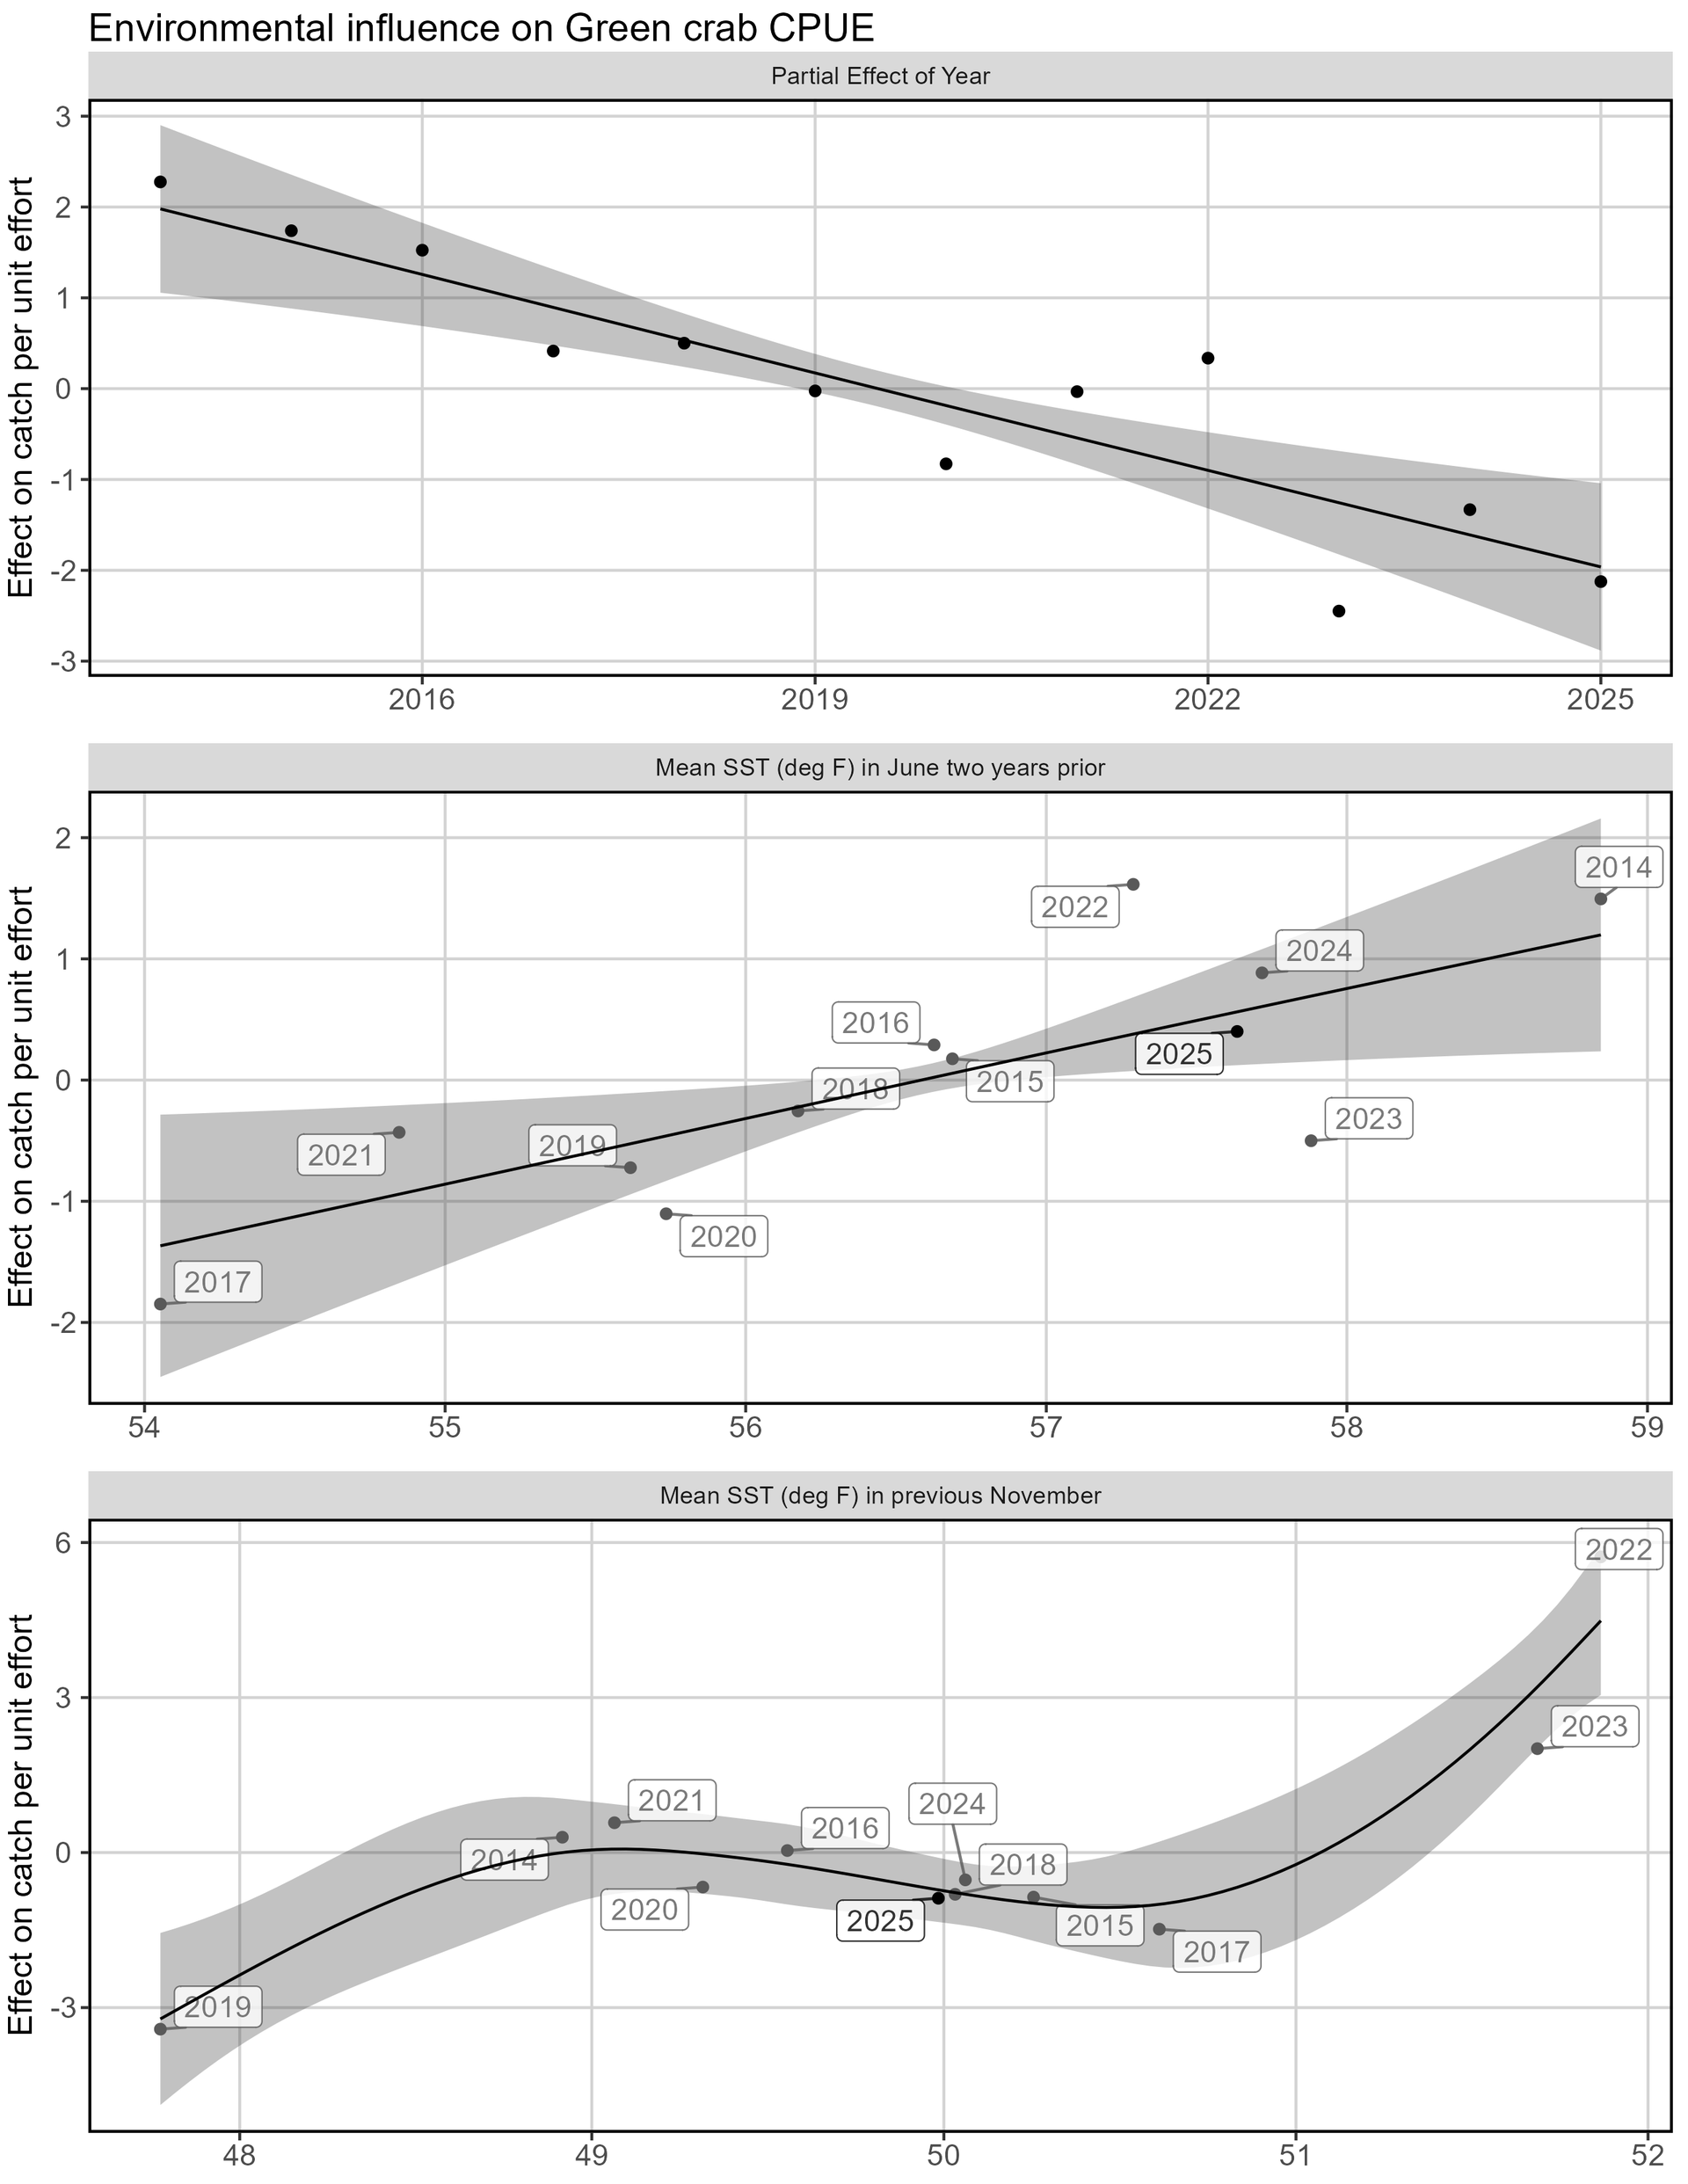
Green crabs are a highly successful invasive species and have colonized the North American coast from Virginia to Newfoundland since their initial accidental introduction in the early 1800s. This success is partially attributed to a broad thermal tolerance and rapid acclimation to local conditions; adults can withstand short exposures to temperatures from 28°F to over 95°F. However, consistent exposure to temperatures below 50°F negatively impacts survival and growth rates at all life stages and can also reduce reproductive output. Extended or extreme cold conditions likely control population size and distribution, and decades of anecdotal evidence from around the world indicate that green crab populations decline after particularly harsh winters. We have tested the relationship between SST and annual green crab CPUE. Though green crabs are benthic organisms that spend most of their time on the sea floor, their preference for relatively shallow areas and the highly mixed nature of Casco Bay support treating surface temperatures as a proxy for bottom temperatures.
Modeling efforts indicated that the CPUE of green crabs observed in our summer beach seine time series is positively correlated with the average SST of the previous November. Cold Novembers are usually followed by low green crab CPUE in the next summer, likely due to the influence of winter temperature on green crab mortality at all life stages. Green crab CPUE is also positively correlated with the average SST of June two years prior. This is likely a reflection of how temperature controls the growth rates and productivity of the parent generation– warmer springs mean longer periods of feeding activity and faster growth, which then translates into shorter times to sexual maturity and higher reproductive output. These terms do not explain all of the variation in annual green crab CPUE. Other environmental differences between years, like salinity, food availability, intraspecific competition, and variability in wind and surface current patterns are not explicitly modeled, but can be partially captured by treating year as an explanatory variable.
On the water
Our monitoring efforts revealed differences in 2025 from some of the observations we’ve been tracking over the last decade, particularly in a marked reduction in overall fish abundance in our seine survey, as well as a reduction in southern species. Some of our partners in the region also noted departures from their long-term data sets. Jeremy Miller, a Research Associate from the Wells National Estuarine Research Reserve (NERR) with years of ecosystem monitoring experience, provided us with the following remarks:
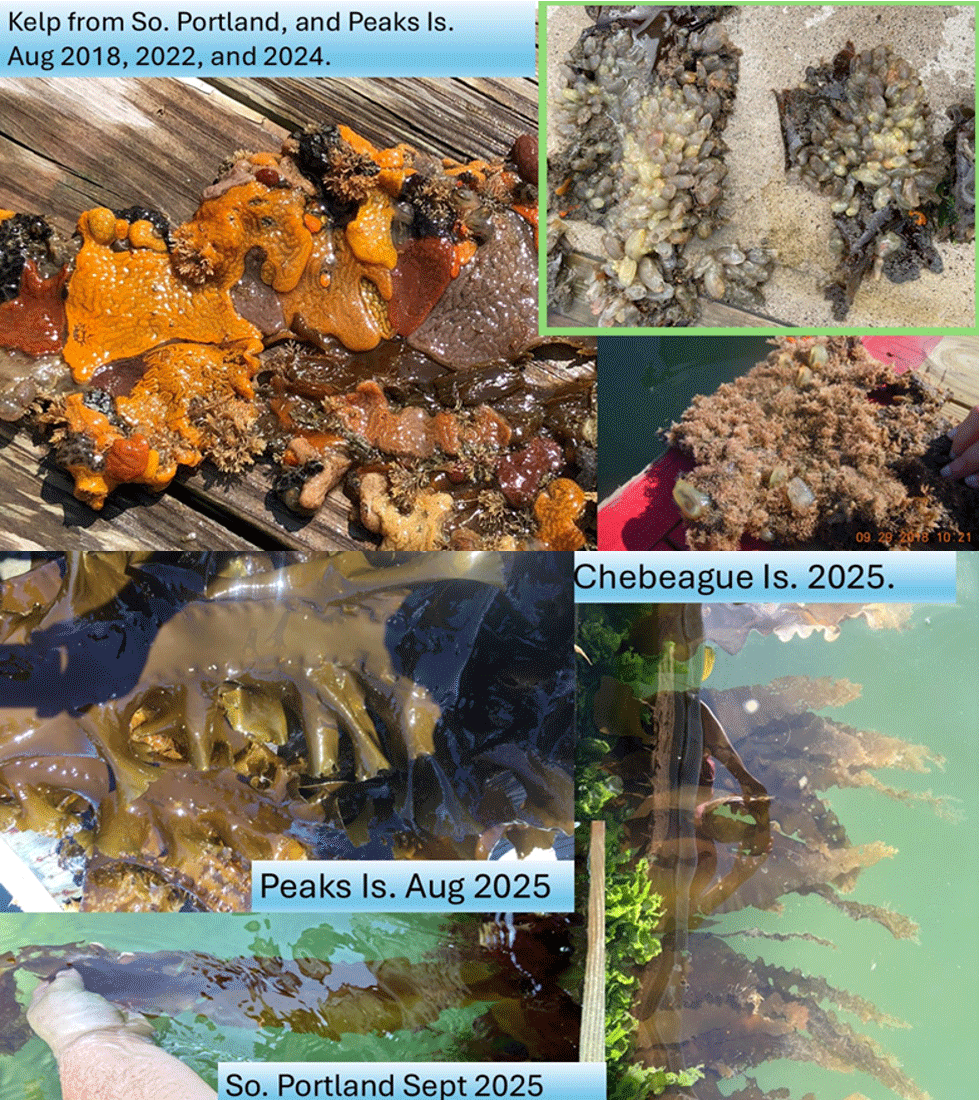
2025 seemed to be a very different year in the coastal Gulf of Maine. This was observed across a number of our long-term monitoring programs, most notably our marine invasive species monitoring program (MIMIC), as well as in our trapping/monitoring efforts for the newly arrived blue crab. 2025 marked the first summer that we were unable to capture any crabs in the Webhannet River System since they were discovered in 2020. And reports from our partner organizations trapping in different systems reported the same. This past summer was also a very slow year for invasive species at our 17 long-term monitoring sites in southern coastal Maine/Casco Bay. 2025 marked the first season on record where the "abundant" ranking (described as "almost everywhere you look") was never used for our tunicate populations at these sites. As the photos show (Figure 7), fouling of kelp by both solitary and colonial tunicates (aka sea squirts) was a serious issue in years past (specifically 2022 – 2024); however, this summer and fall, we observed a lot of beautifully clean and healthy kelp fronds at the same sites where kelp was almost completely covered in previous years. And although samples are still being processed, to date, we have not seen any "Gulf Stream Orphans" or southern species in our monthly larval fish collections from 2025.
Jeremy Miller Research Associate Wells National Estuarine Research Reserve
Angie Brewer, the Marine Unit Leader for the Bureau of Water Quality at the Maine Department of Environmental Protection (DEP), provided us with additional information along a similar vein (of improvement, likely related to cooler temperatures).
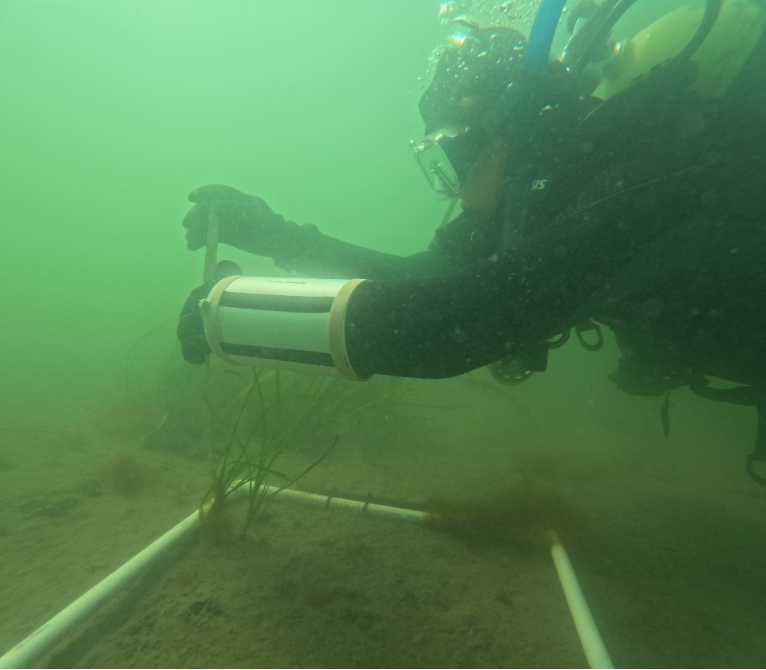
After observing steady declines in eelgrass density and aboveground biomass (percent cover) since we started SCUBA monitoring of Portland area eelgrass beds in 2018, 2025 offered some hope. Over the duration of DEP Marine Unit monitoring from June to September 2025 and as compared to 2024, our staff observed a small increase in the distribution and aboveground biomass of eelgrass at two of our three sites, one off East End Beach and the other on the northwest side of Fort Gorges, including the presence of small eelgrass patches near the historic deep edge of the beds. Continuous temperature data were observed to closely correlate with eelgrass presence and distribution, with cooler sites presenting more eelgrass tissue, including shoots with less algal fouling.
Angie Brewer Marine Unit Leader Maine Department of Environmental Protection
Insights and commentary
Though long-term warming of the Northwest Atlantic region is expected to continue, changes in broad-scale oceanic features, like the strength of the Atlantic meridional overturning circulation and the position of the Gulf Stream, may be causing a brief pause in the rapid warming seen within the Gulf of Maine in recent decades (Koul et al. 2024). Both the single-location Portland Harbor tide gauge and the spatially-integrated Casco Bay MUR datasets have recorded a decline in average annual surface temperatures since the recent highs of 2021.
Low catches of “cool-adapted” species like Atlantic herring and Atlantic tomcod defied our expectation that they would benefit from relatively cooler spring and summer conditions, and therefore be more abundant in the nearshore region. However, concurrent low catches of “warm-adapted” species like Atlantic silverside, green crabs, blue crabs, and Gulf Stream Orphans met our expectation that these organisms would be disadvantaged from similar temperature conditions, and therefore would be less abundant. The resulting summer community composition, which was characterized by low abundance of nearly all frequently encountered species, is unique among all the years of our seine survey program. The ecological drivers of this abnormality are not yet clearly understood, and likely include factors beyond water temperature alone.
Monitoring programs like CBASS are ideal tools to identify potential changes in nearshore ecosystems. Long-term, high-frequency, fine-scale “local” surveys can identify patterns in phenology or habitat use that may not be noticeable at regional or global scales. Accurate characterization of these patterns is key to defining the drivers of broader ecological change. “Anomalous” data from local surveys, characterized by a disruption in the expected relationship between important environmental parameters and the population and distribution dynamics of studied species, may forecast changes at broader scales. Our continued collection and analysis of ecological data in Casco Bay will enable us to identify “anomalous” years like 2025, and may eventually produce a clear mechanistic link between changes in the environment and changes in the nearshore community dynamics.
Looking ahead
With more than a decade of consistent fish-focused monitoring and an established presence in Casco Bay, we are well-positioned to expand this effort to investigate how other key species, such as seabirds and subtidal mussels, are responding to the same warming trends driving changes in fish communities.
Bird observations
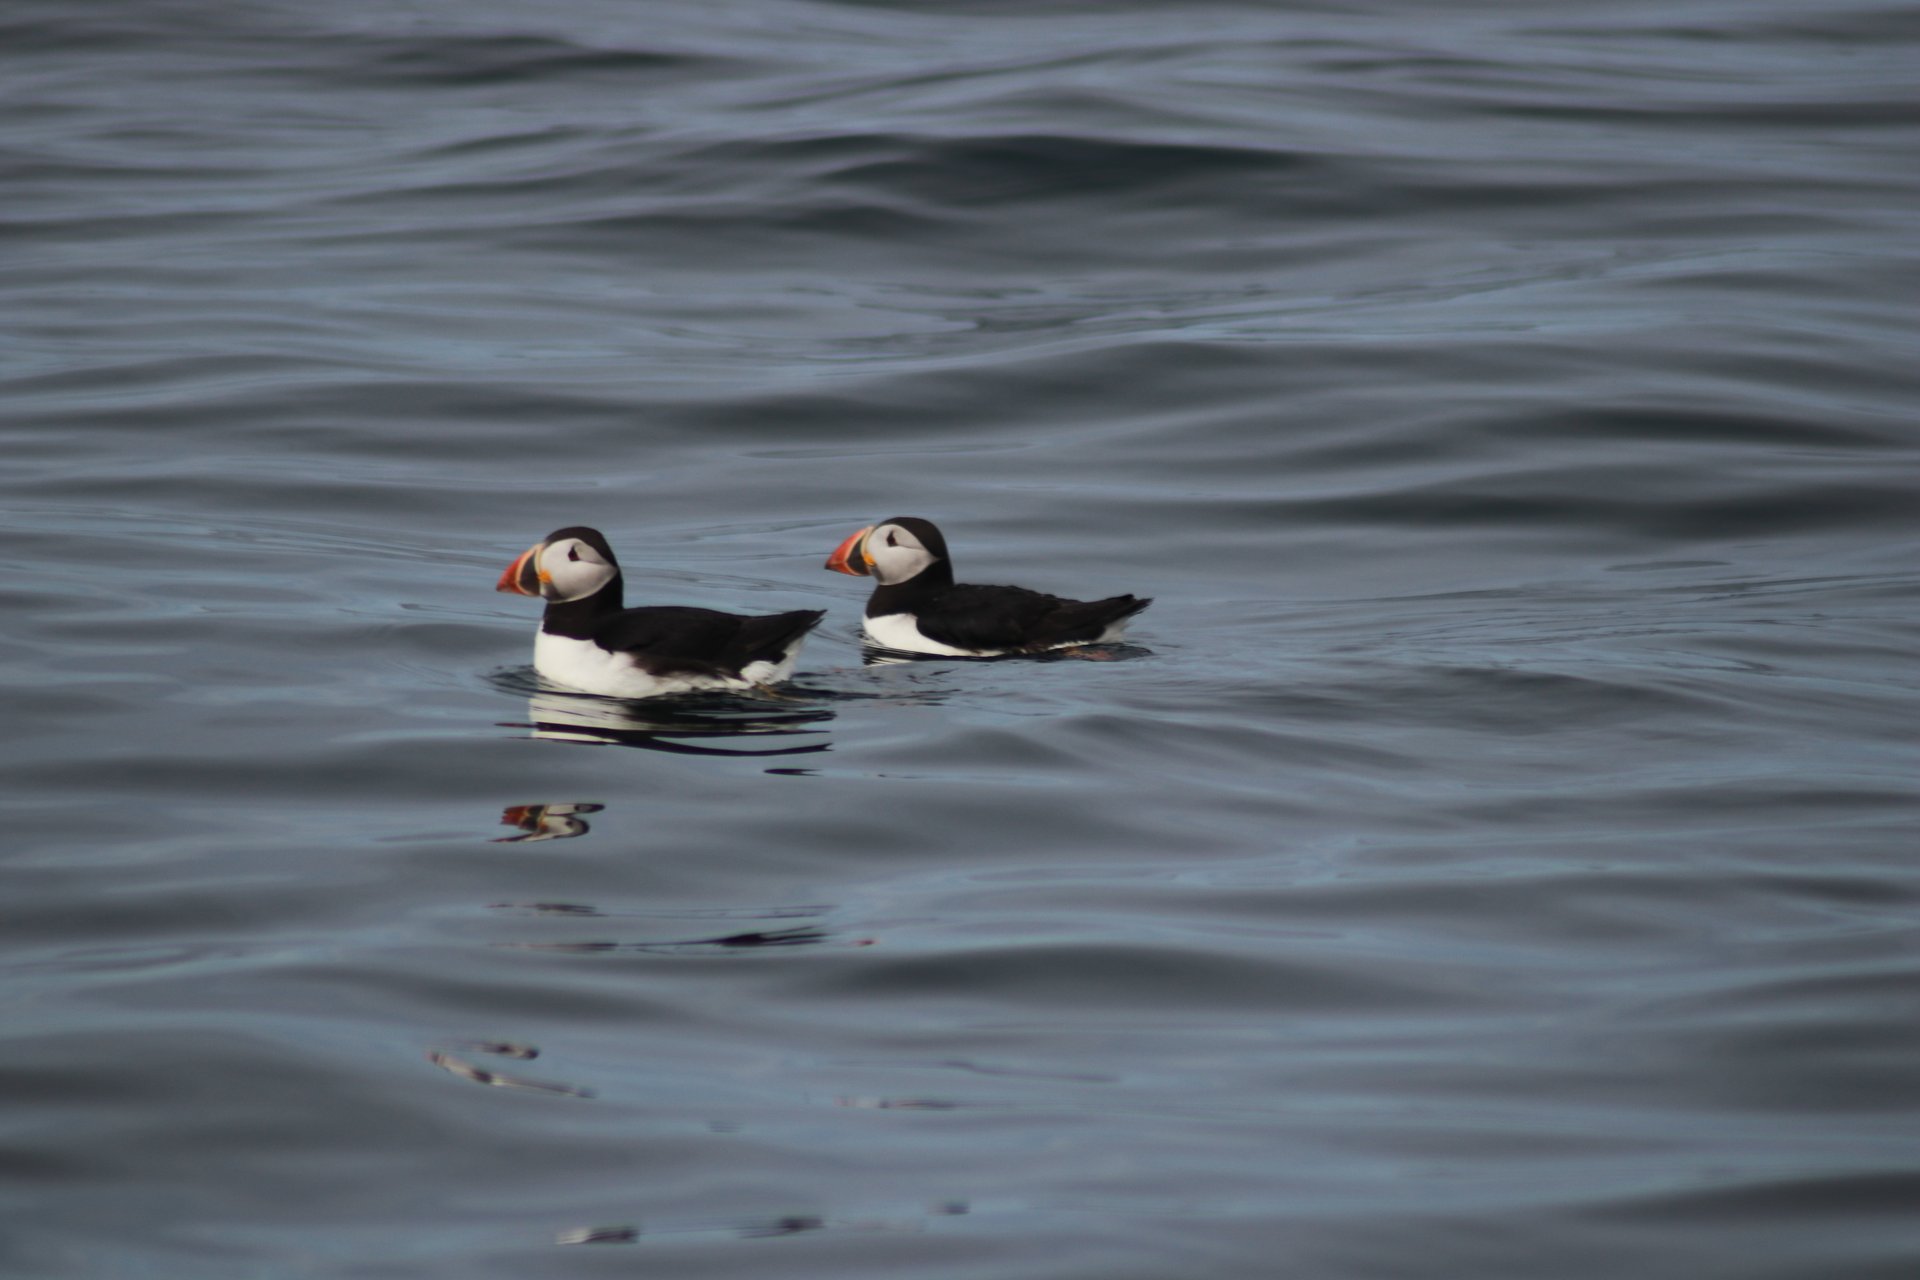
This summer we added marine bird observations to our CBASS beach seine surveys in western Casco Bay. These birds depend on the ocean for their food and food for their young, making them useful indicators of ecosystem conditions. The Gulf of Maine hosts a variety of these species during the summer, from the common Herring gull (Larus argentatus), to the more elusive Atlantic puffin (Fratercula arctica). These summer visitors fall into two types: breeding species that nest on offshore islands (colonies), and non-breeding species that are here to exploit the region’s rich foraging grounds and breed elsewhere (typically in the southern hemisphere). Colonial nesting species, like puffins and terns, could make particularly good ecosystem indicators because they can’t just follow the food — they have to regularly return to their colonies to feed and care for their young. As a result of these constraints, they need to find the most productive waters nearby their nests. Additionally, they are much easier to observe and count than fish or zooplankton aggregations beneath the ocean’s surface.
Results from our first summer were quite variable, though generally reflected what we were seeing with other monitoring efforts. Early outings were relatively quiet. Cooler conditions with fewer key forage fish, including herring and silversides, coincided with fewer seabirds foraging nearby, suggesting they were using other waters to find prey for themselves and their young. Later in the season we observed more seabird activity just offshore from our sampling area, particularly Common terns (Sterna hirundo). These terns could have nested nearby, at the colony on Outer Green Island (managed by US Fish and Wildlife Service's Maine Coastal Islands National Wildlife Refuge Complex and National Audubon's Seabird Institute). Relating marine bird observations to seine catches highlighted just how patchy and dynamic this coastal ecosystem is: while birds were occasionally observed alongside high forage fish catches, this wasn't always the case. We plan to continue these observations this summer and explore historical data to better understand these ecosystem connections.
Mussel bed distribution
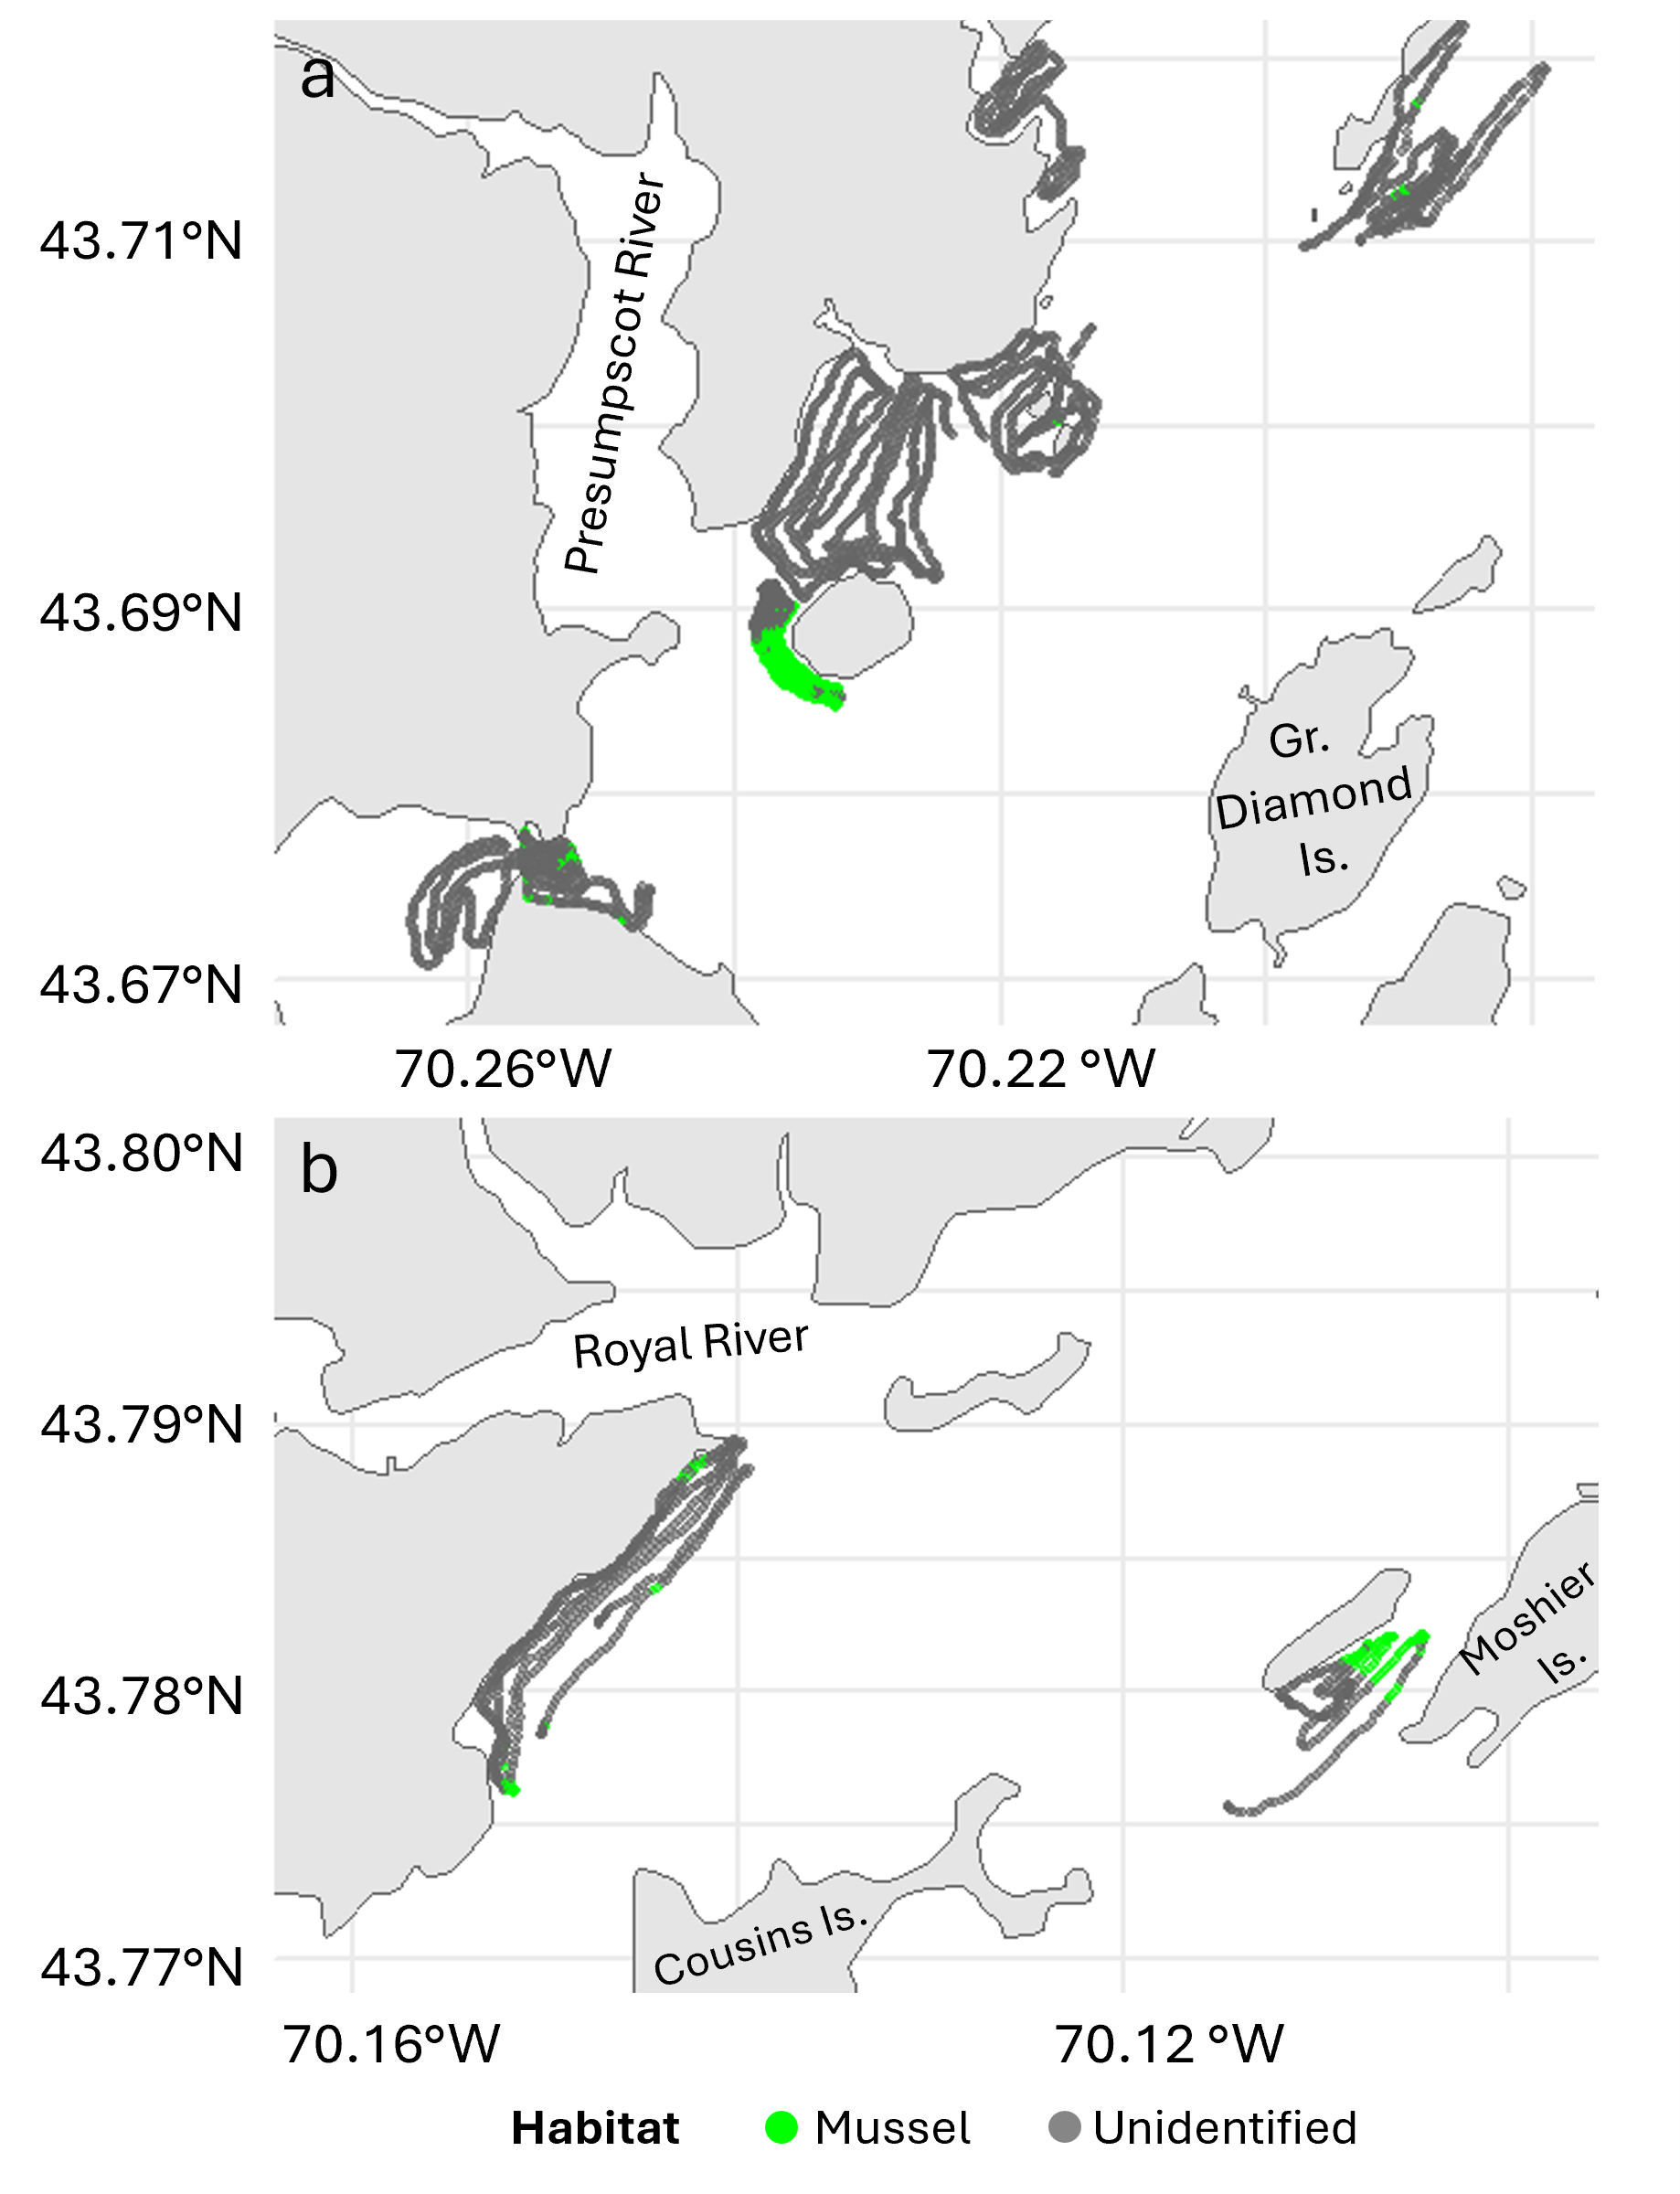
Gulf of Maine blue mussel populations may be in decline, as evidenced by both a reduction in commercial landings and the loss of prominent mussel beds. Warmer air and water temperatures, predation from green crabs, and overfishing may have contributed to a shift in biomass from the intertidal zone, an area intermittently submerged at high tide and exposed at low tide, to the consistently-submerged subtidal zone. We have started acoustic surveys around Casco Bay to map subtidal mussel beds. Like a bat’s echolocation or a recreational-grade fish finder, scientific-grade acoustic instruments send out sound pulses and interpret the returning echoes to classify objects. These instruments can distinguish between a range of bottom habitat types, including mud, live mussels, and shell hash. Starting from a known subtidal mussel bed off Mackworth Island to ground-truth our data, we have identified other subtidal mussel beds at Back Cove, Clapboard Island, Yarmouth, and Moshier Island (Figure 7).
Community members can help us advance this project by visually surveying their nearby tidal waters at extreme low tides for mussel beds; your data could help us plan our next round of acoustic mussel surveys. We plan to continue these surveys to monitor how blue mussels may respond (underwater) to environmental and ecological change in Casco Bay.


