Gulf of Maine Warming Update: Summer 2022

Announcements | Sep 29, 2022

Over the past decade, scientists have led a body of research that highlights the rapid pace of warming in the Gulf of Maine. To help keep you informed, we share seasonal and annual updates about conditions in the Gulf of Maine.

Read on for an inside look at what we've learned in our summer 2022 Gulf of Maine warming update.

This is a graphic for our Gulf of Maine seasonal warming update for Summer 2022.

Highlights

The average SST for the Gulf of Maine during the summer of 2022 (June 1–August 31) was 62.14°F, making it the third hottest summer on record for the period of 1982 through 2022—the period over which the satellite data used are available. These temperatures are 3.89°F above the long-term (1982–2011) summer average of 58.25°F.

Weekly Temperatures

In the below table, we highlight how the SST for each week this summer compares to a 30-year baseline period (climatological averages from 1982 through 2011).

The observed SST, long-term average SST, and SST anomalies (departures from the long-term average SST) are shown. As expected, SSTs generally rise as the summer season progresses, with anomalies showing no clear trend over the course of the season. Rather, departures from the long-term average hovered around 3°F above normal with a few weeks punctuated by anomalies exceeding 5°F.

Table 1. Observed, climatological average, and deviation from the climatological average (i.e., temperature anomaly) for SST at a weekly resolution in the Gulf of Maine during summer 2022 (defined as June 1st – August 31st).

Monthly Statistics

Looking at monthly averages (as opposed to week-by-week conditions), we see that each month was 3.36°F or more above the 1982–2011 climatological average. August showed the largest deviation from historical norms, with an average SST anomaly of 4.56°F.

Table 2. Observed, climatological average, and deviation from the climatological average (i.e., temperature anomaly) for SST at a monthly resolution in the Gulf of Maine during summer 2022 (defined as March 1 – May 31).

Seasonal Trends and Anomalies in Context

The Gulf of Maine is an area of particular interest to the scientific community because of the remarkable rate of warming it has experienced in recent years, coupled with its importance as a major driver for the regional economy. When looking at average summer temperatures, there is a clear long-term increase, with SSTs warming at a rate of 1.06°F per decade—a rate that is four times faster than that of world’s oceans, as a whole. Recent warm summer SST anomalies are consistent with a thermal regime shift that occurred around 2010.

Figure 1. Average annual summer SST anomalies in the Gulf of Maine from 1982 through 2022. The solid orange line indicates the trend for the full time series for the Gulf of Maine. A solid blue line indicates the trend for the full time series for the global oceans.

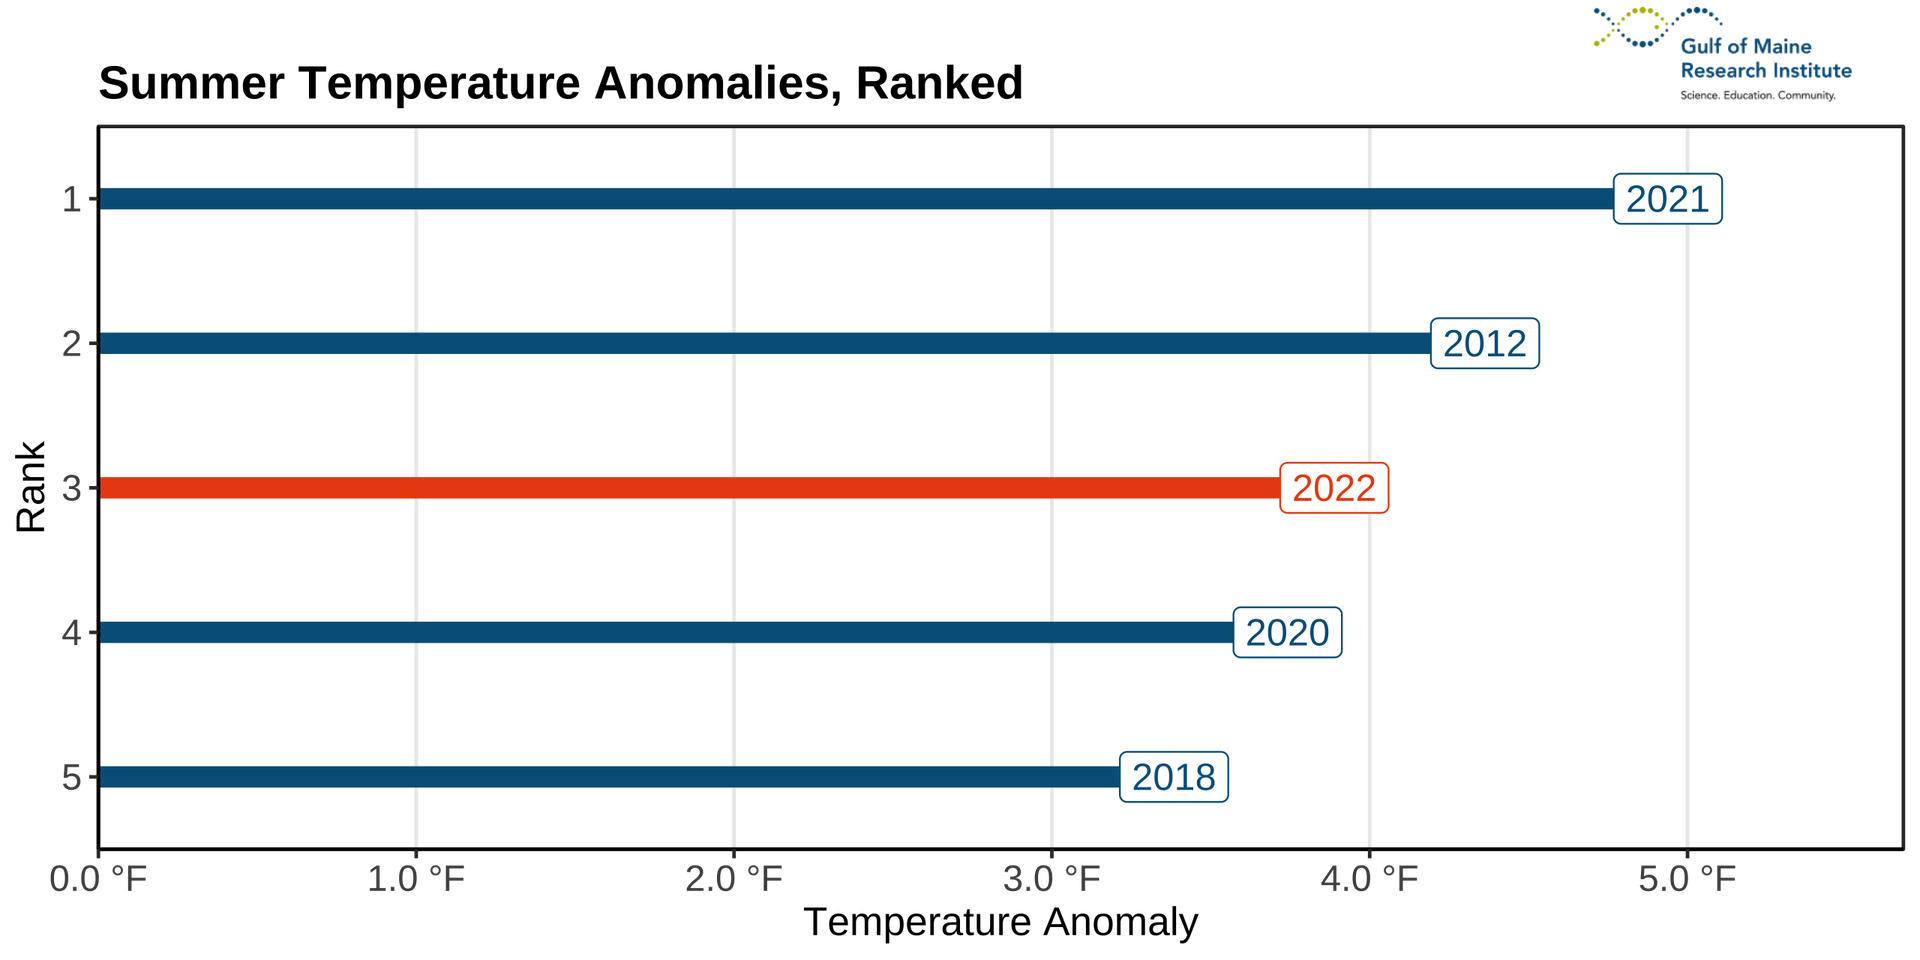
How Does 2022 Compare?

2022 is among the warmest summers observed in the Gulf of Maine during the 41-year satellite record. When compared against all previous summers for which we have reliable satellite data (i.e., back to 1982), this year ranks third among the hottest on record. The top five warmest summers on record have all occurred in the last decade.

Figure 2. An illustration of where summer 2022 ranks among the top five warmest summer seasons on record in the Gulf of Maine.  The top two lines are blue, the bottom two lines are blue, and the middle line, representing the current year (2022) is orange. The lines are shorter on the bottom and get longer toward the top.
Figure 2. An illustration of where summer 2022 ranks among the top five warmest summer seasons on record in the Gulf of Maine

Marine Heatwave Timeline

The most commonly used definition of a “marine heatwave” (MHW) is when daily average SSTs exceed the 90th percentile of a climatological (i.e., 30-year) average for at least five consecutive days. Successive heatwave gaps of two days or less are considered part of the same event.

Using this broadly accepted definition, the Gulf of Maine experienced MHW conditions for 95% of summer 2022.

Figure 3. A timeseries of marine heatwave (MHW) conditions in the Gulf of Maine extending from January 1 through August 31, 2022. Black lines representing the long-term (i.e., 1982 – 2011) average SST, the 10th percentile, and 90th percentile for a given day in the Gulf of Maine are labelled to indicate climatological reference points; a solid line (red for marine heatwave or blue for a non-event) indicate the observed SST this year; red and blue shading illustrates how far the observed SST falls from the climatological mean.

Presenting SST conditions in terms of anomalies (Figure 4) as opposed to absolute values (Figure 3) illustrates in greater detail the magnitude of MHW conditions throughout the summer.

The most extreme anomalies occurred in August, with some daily temperature anomalies exceeding 6°F above the climatological average.

Figure 4. A timeseries of daily average SST anomalies in the Gulf of Maine (solid red line) compared to marine heatwave (MHW) conditions (dashed black line) in the Gulf of Maine for the period January 1 through August 31, 2022.

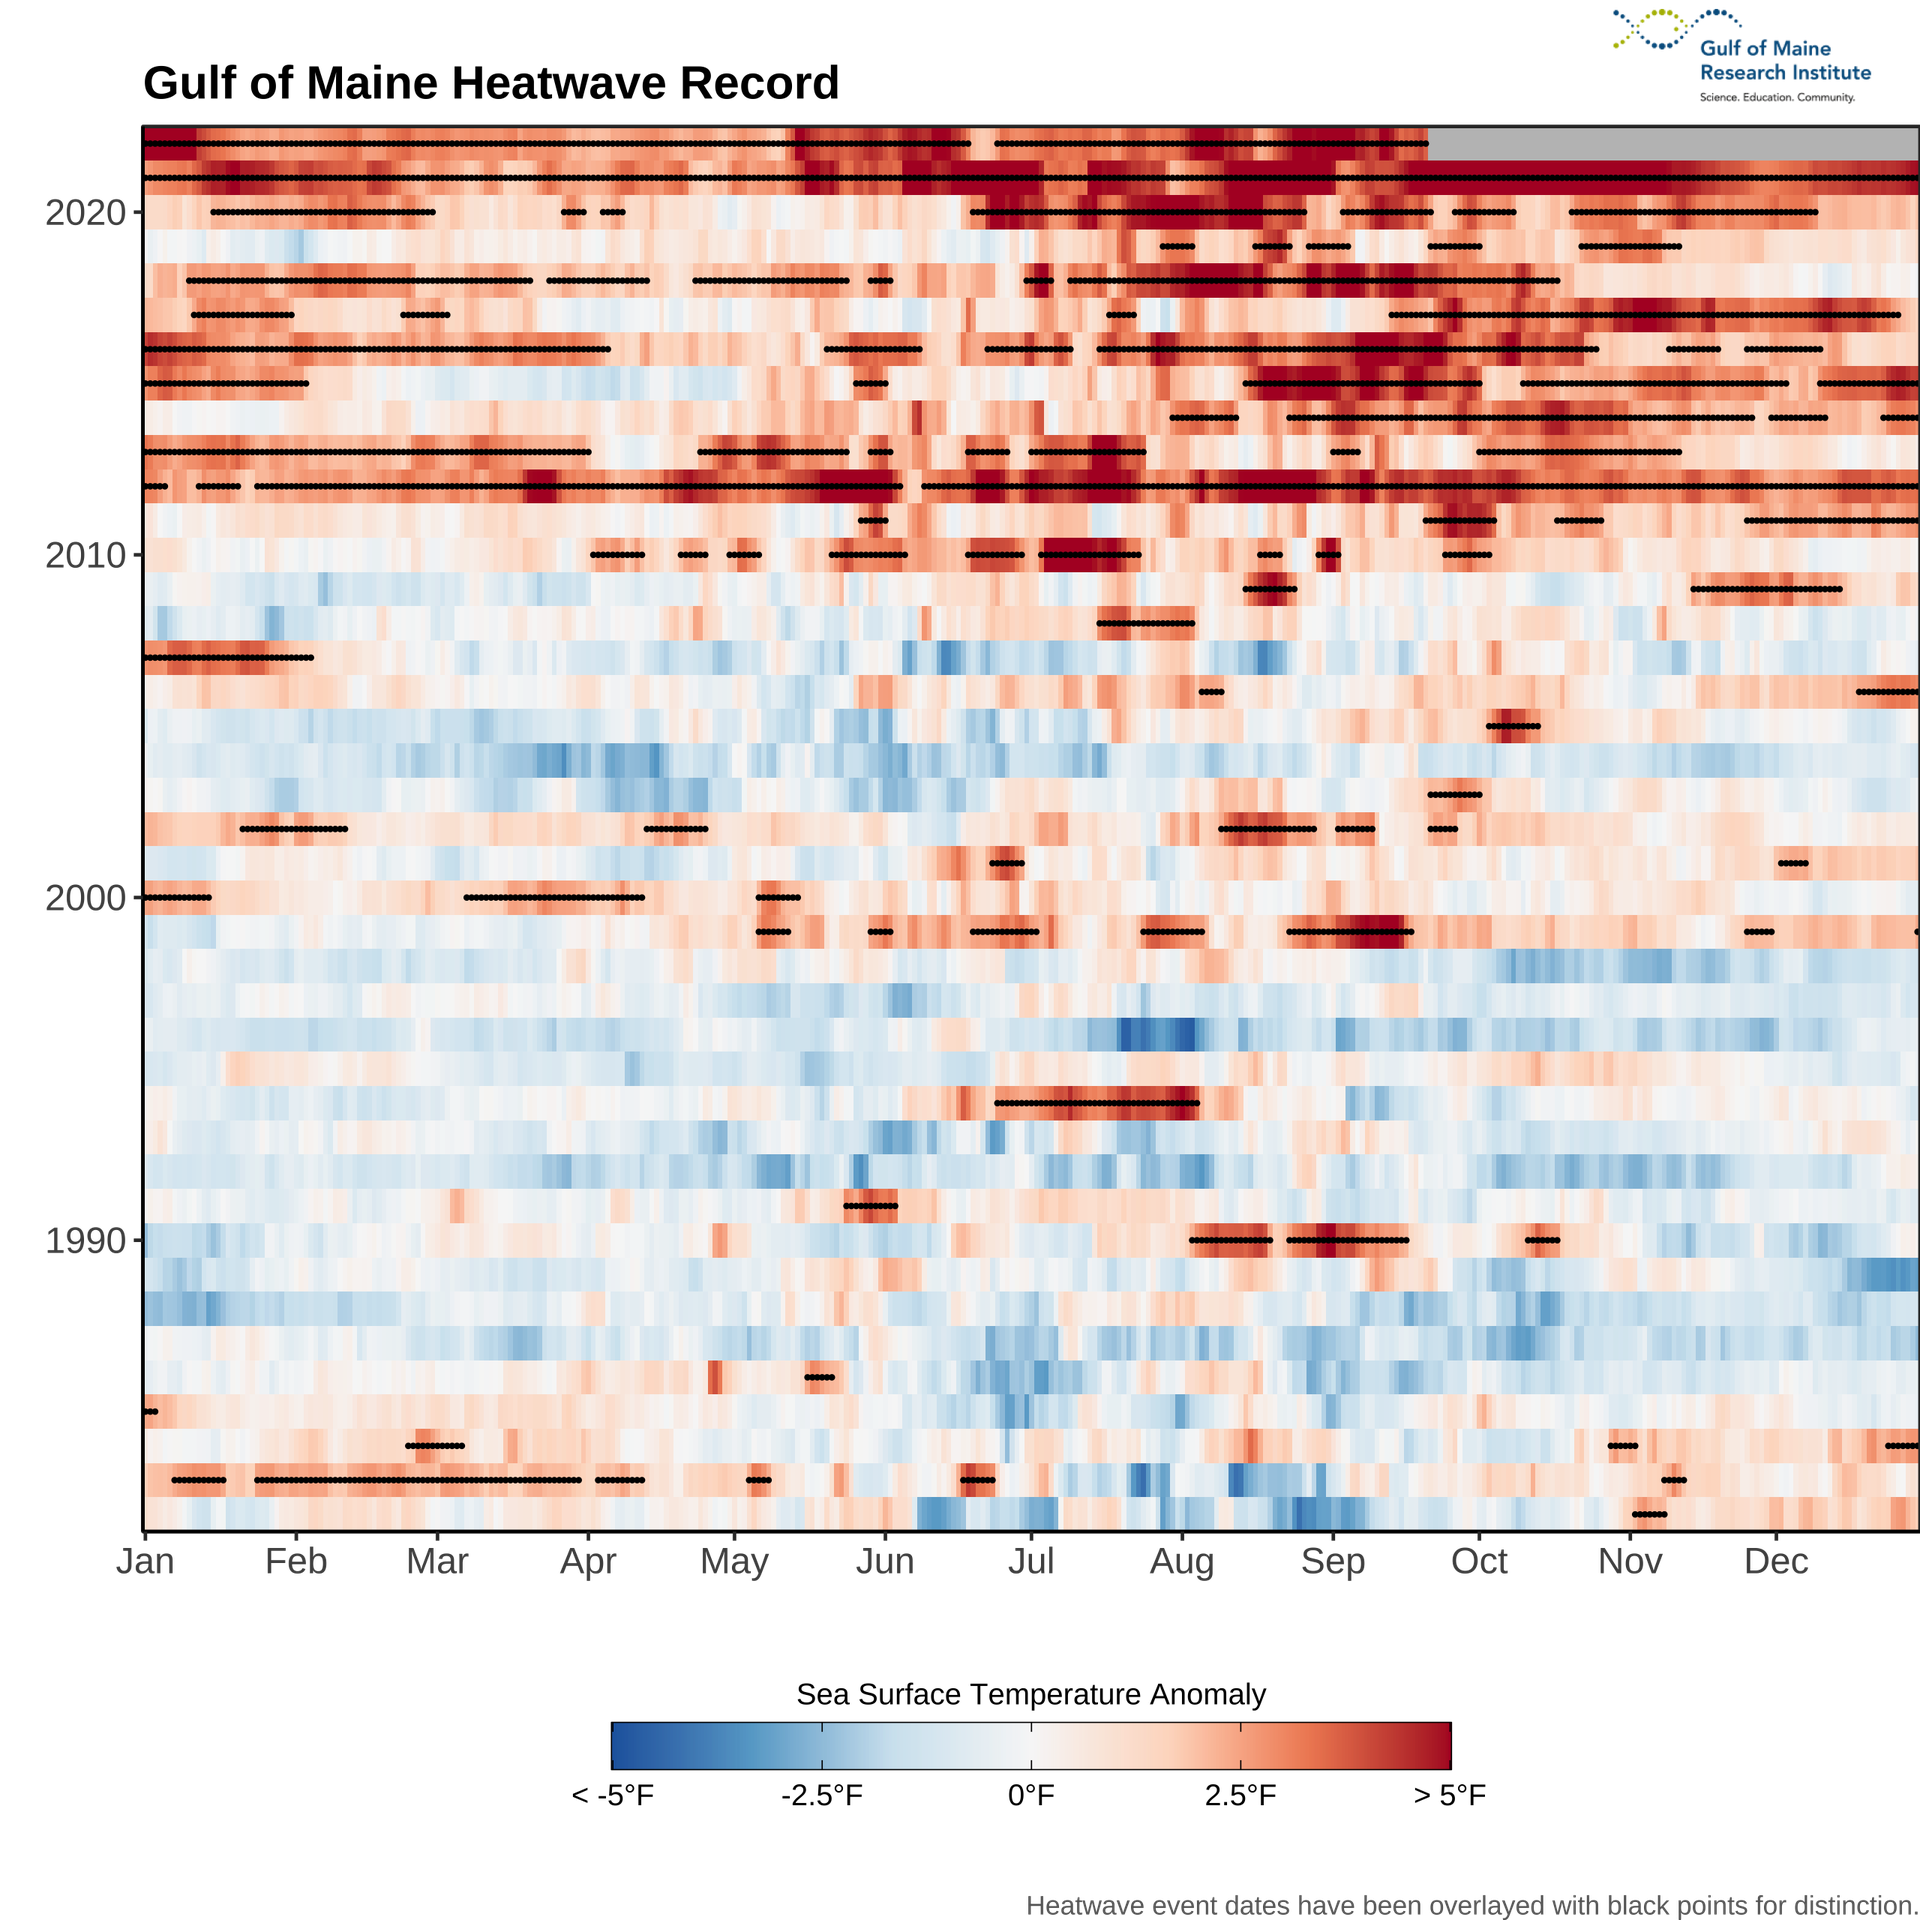
Looking at the full record of daily SST anomalies in the Gulf of Maine (Figure 5), the distinct thermal regime shift beginning around 2010 is evident. Indeed, since 2012, the Gulf of Maine has experienced far more persistent—and intense—MHW conditions (indicated by solid black lines in Figure 5) than at any other point in the satellite record.

Figure 5. Heat map of daily SST anomalies from the beginning of 1982 through the middle of 2022. Not only do more large warm anomalies (darker reds) appear more frequently in recent years, but the frequency and duration of marine heatwave events (black lines) in the Gulf of Maine has become more pronounced in the last decade.

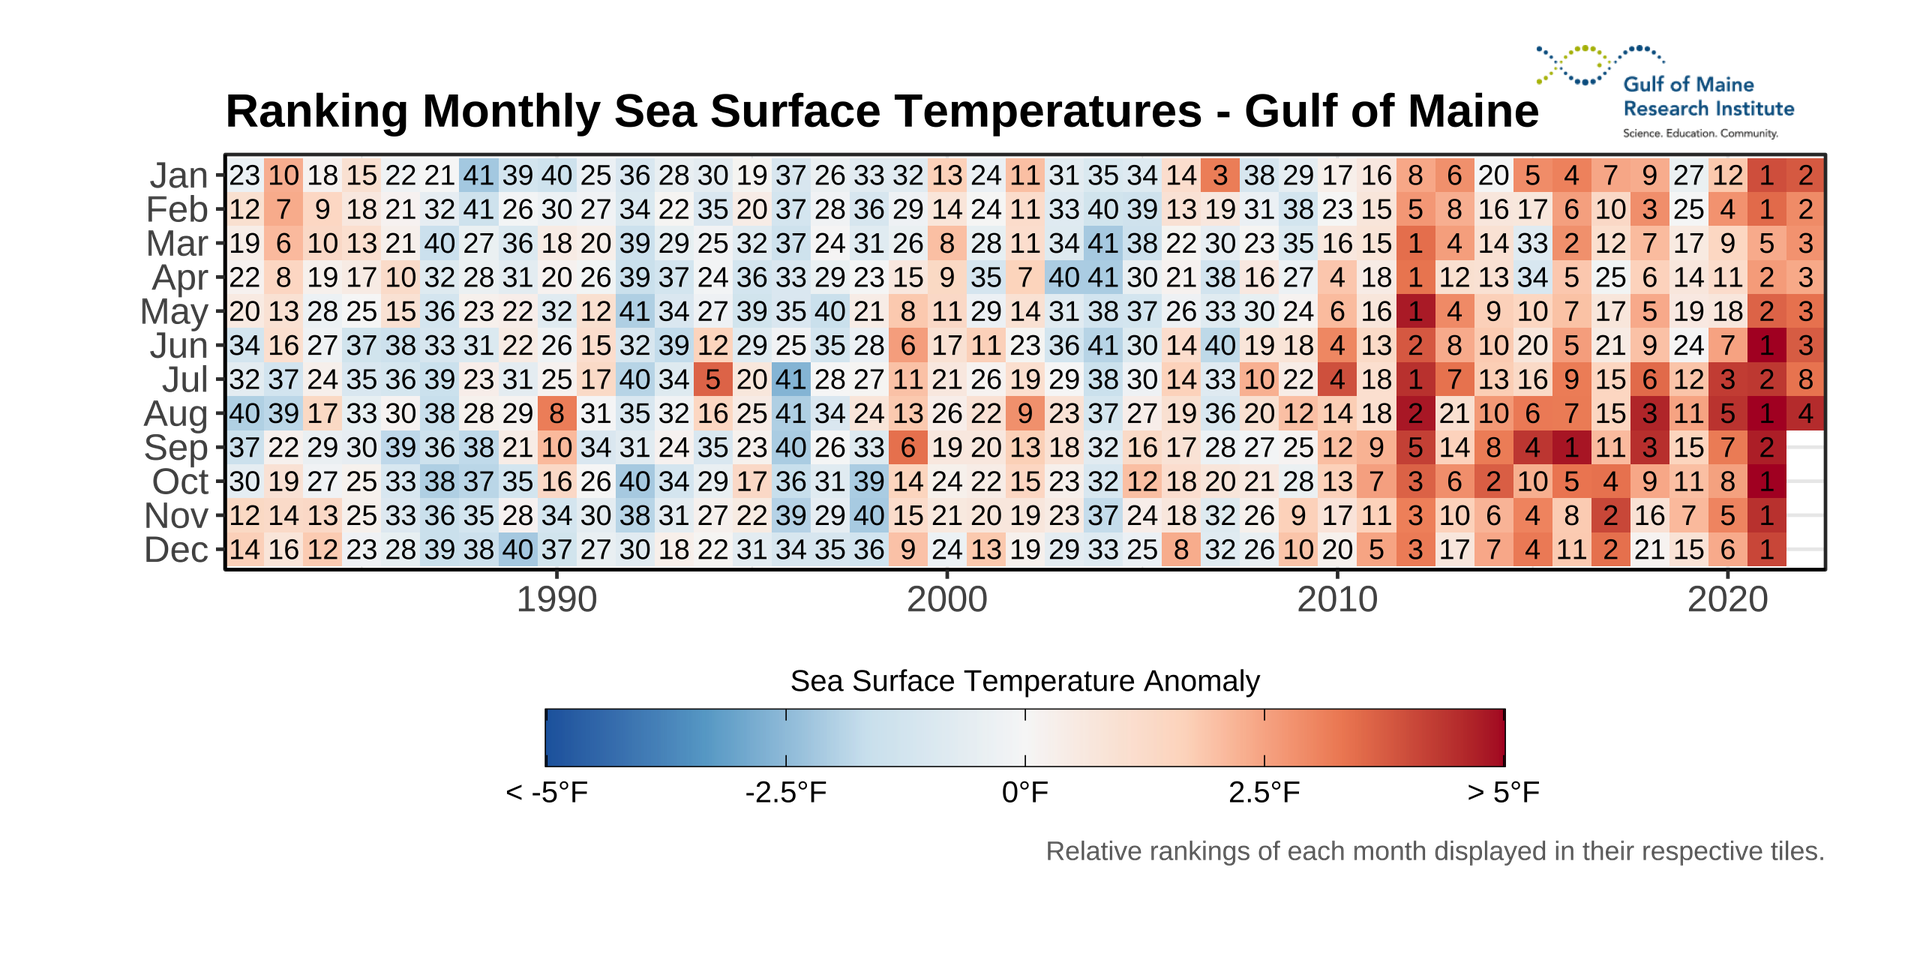
Taking each month as a whole, we can rank them against months in years past, as illustrated in Figure 6. This year the summer months were each among the top ten warmest on record. June and August were the third and fourth warmest, respectively, with July coming in as the eighth warmest.

Figure 6. A heatmap displaying the average temperature anomaly for each month, for each year. Text within each cell indicates how hot that month was compared to the same month across all years beginning at 1 for the hottest month on record. Darker red cells are hotter, and lighter blue cells are cooler.
Figure 6. A heatmap displaying the average temperature anomaly for each month, for each year. Text within each cell indicates how hot that month was compared to the same month across all years beginning at 1 for the hottest month on record.

Longest Heatwave on Record

This summer marked the conclusion of the Gulf of Maine’s longest marine heatwave event on record. This event spanned from January 1st, 2021 until June 19th, 2022—ultimately lasting a total of 535 days. During that period, temperatures were on average 3.87°F above temperatures observed during the 1982–2011 climatological reference period.

Figure 7. A timeseries of marine heatwave (MHW) conditions in the Gulf of Maine covering the duration of the Gulf of Maine's record heatwave beginning back in January 2021. Black lines representing the long-term (i.e., 1982 – 2011) average SST, the 10th percentile, and 90th percentile for a given day in the Gulf of Maine are labelled to indicate climatological reference points; a solid line (red for marine heatwave or blue for a non-event) indicate the observed SST this year; red vertical shading illustrates how far the observed SST falls from the climatological mean.

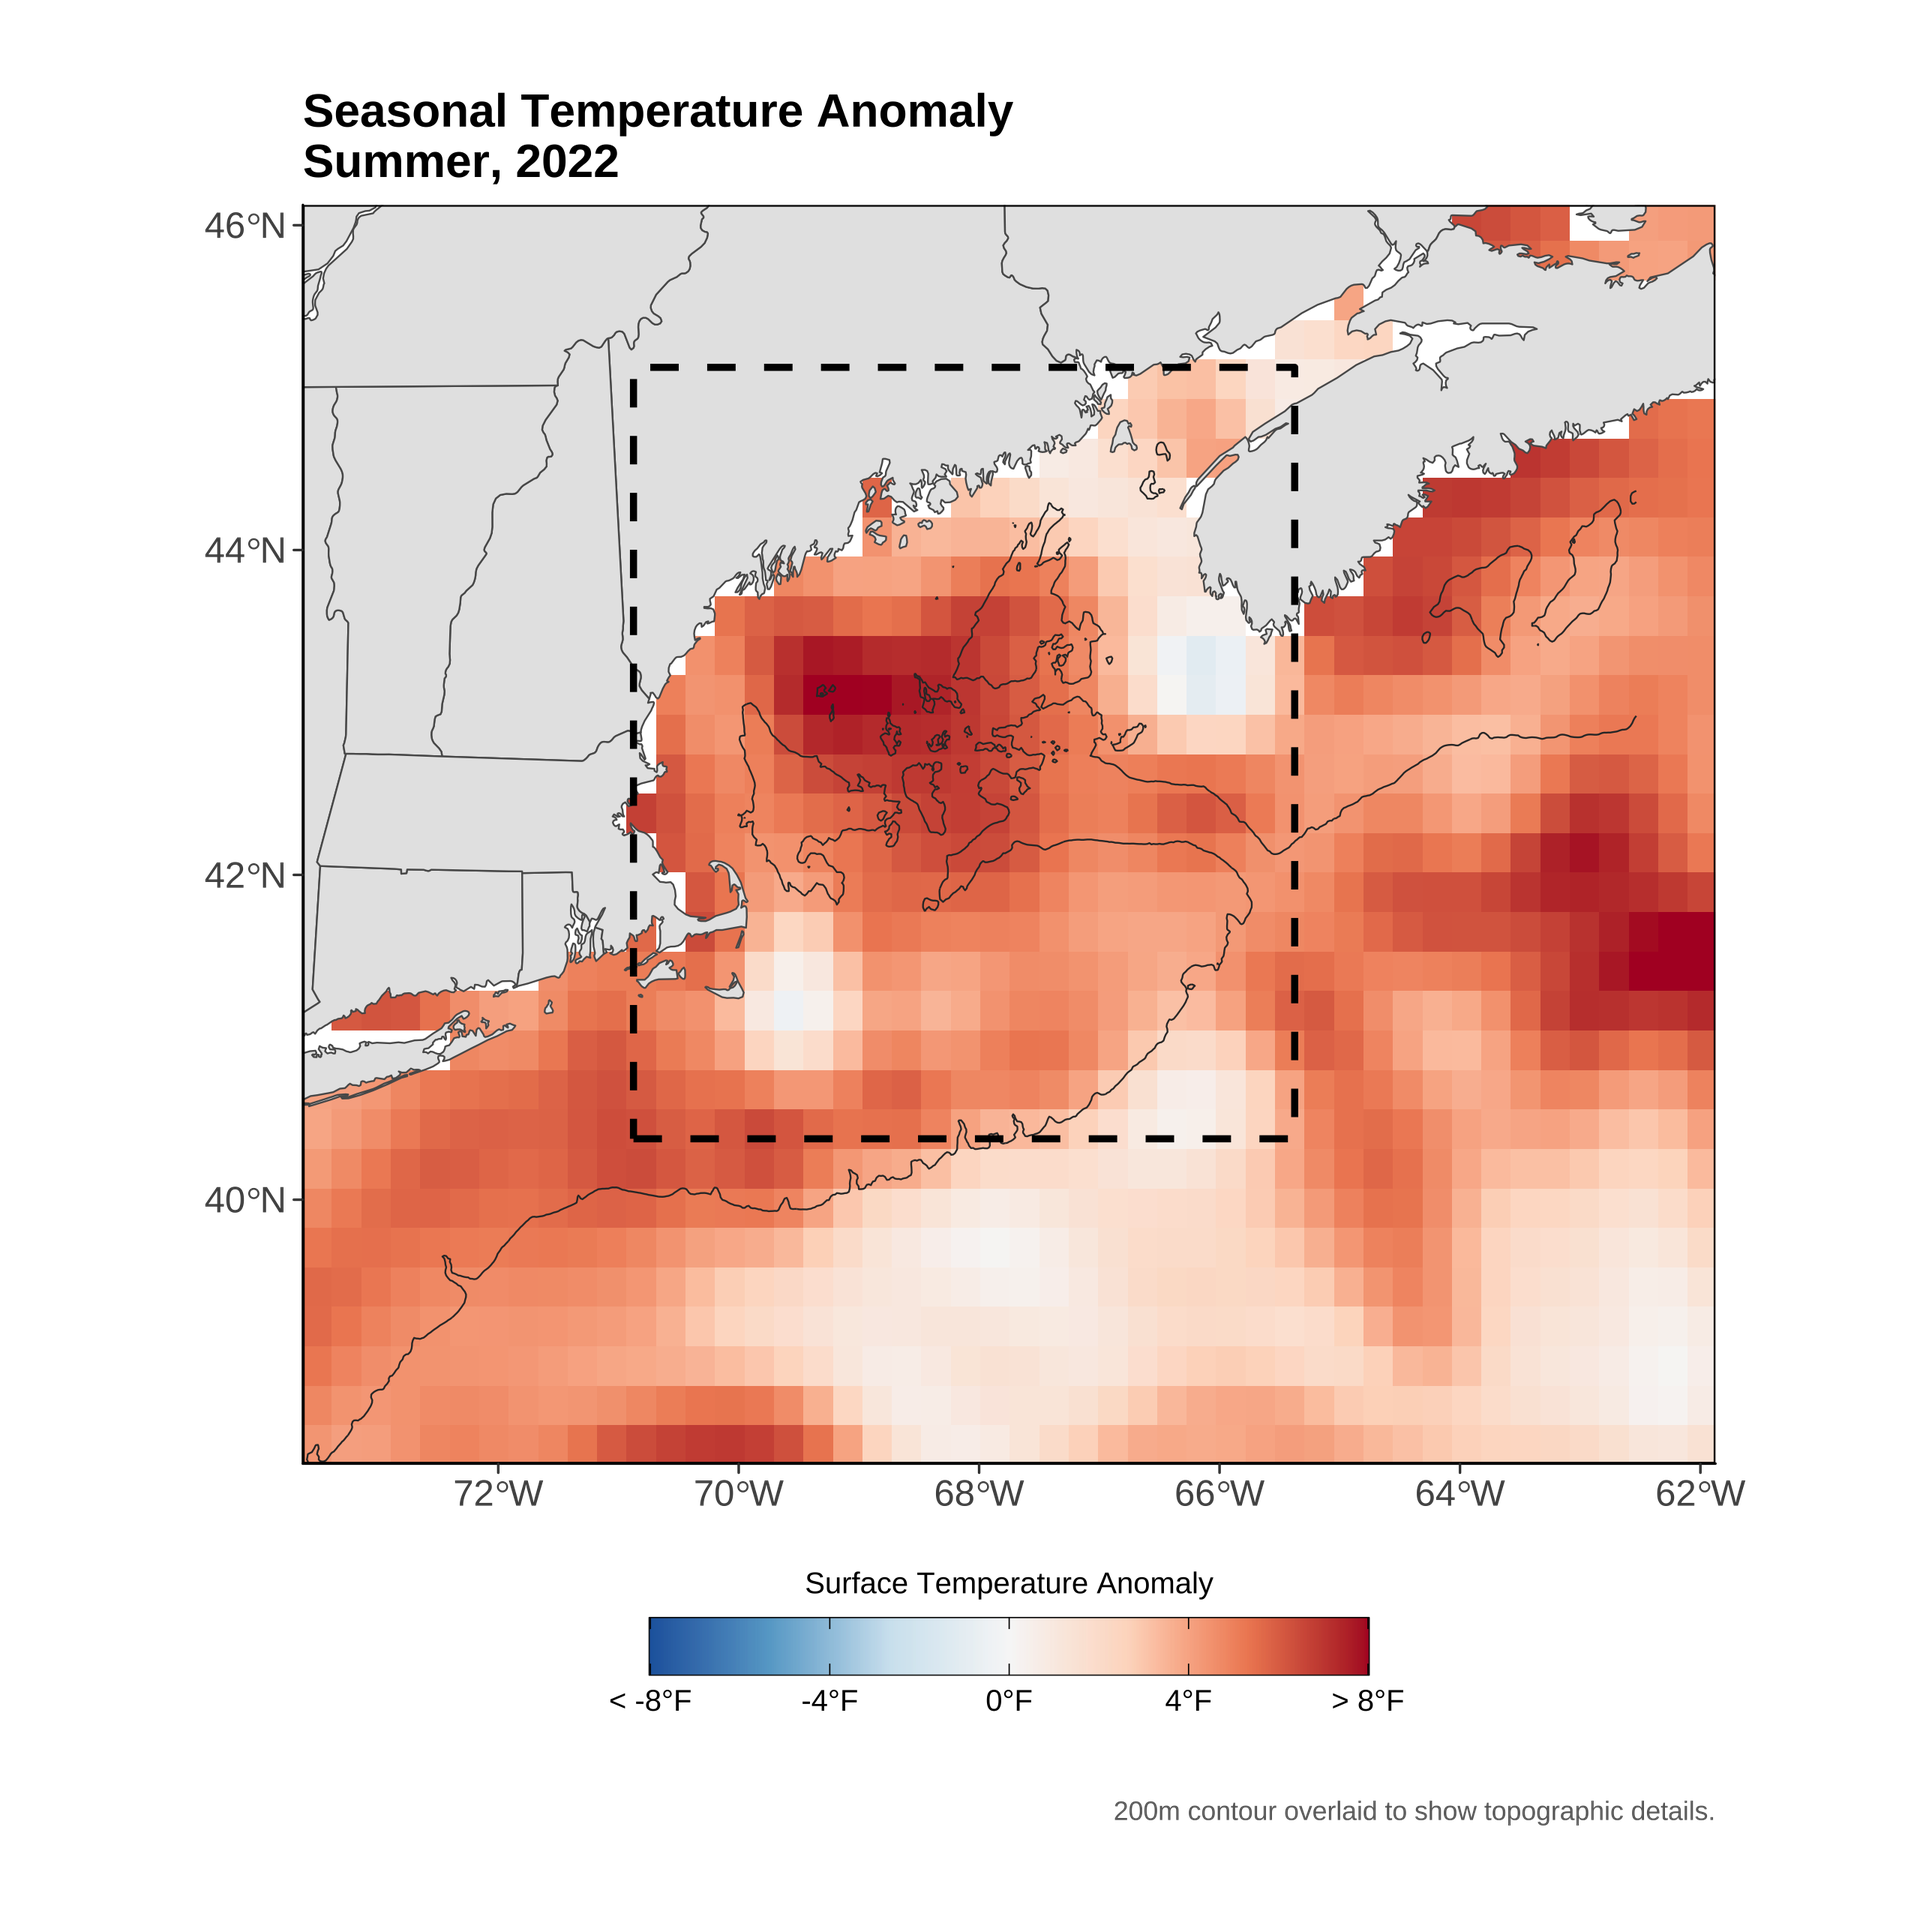
Spatial Distribution of Seasonal Anomalies

From a spatial perspective, almost all of the Gulf of Maine experienced above average SSTs during summer 2022, with a notable hotspot towards the center of the region (Figure 8). As highlighted in previous warming updates, the region just south of Georges Bank experiences significant inter-seasonal and inter-annual temperature variability because of the dynamic influence of the Gulf Stream in this more open-ocean region.

Figure 8. Map of average SST anomalies in summer 2022. The box outlined by the black dashed line denotes the region of study for the analysis. Darker red regions indicate stronger anomalies.

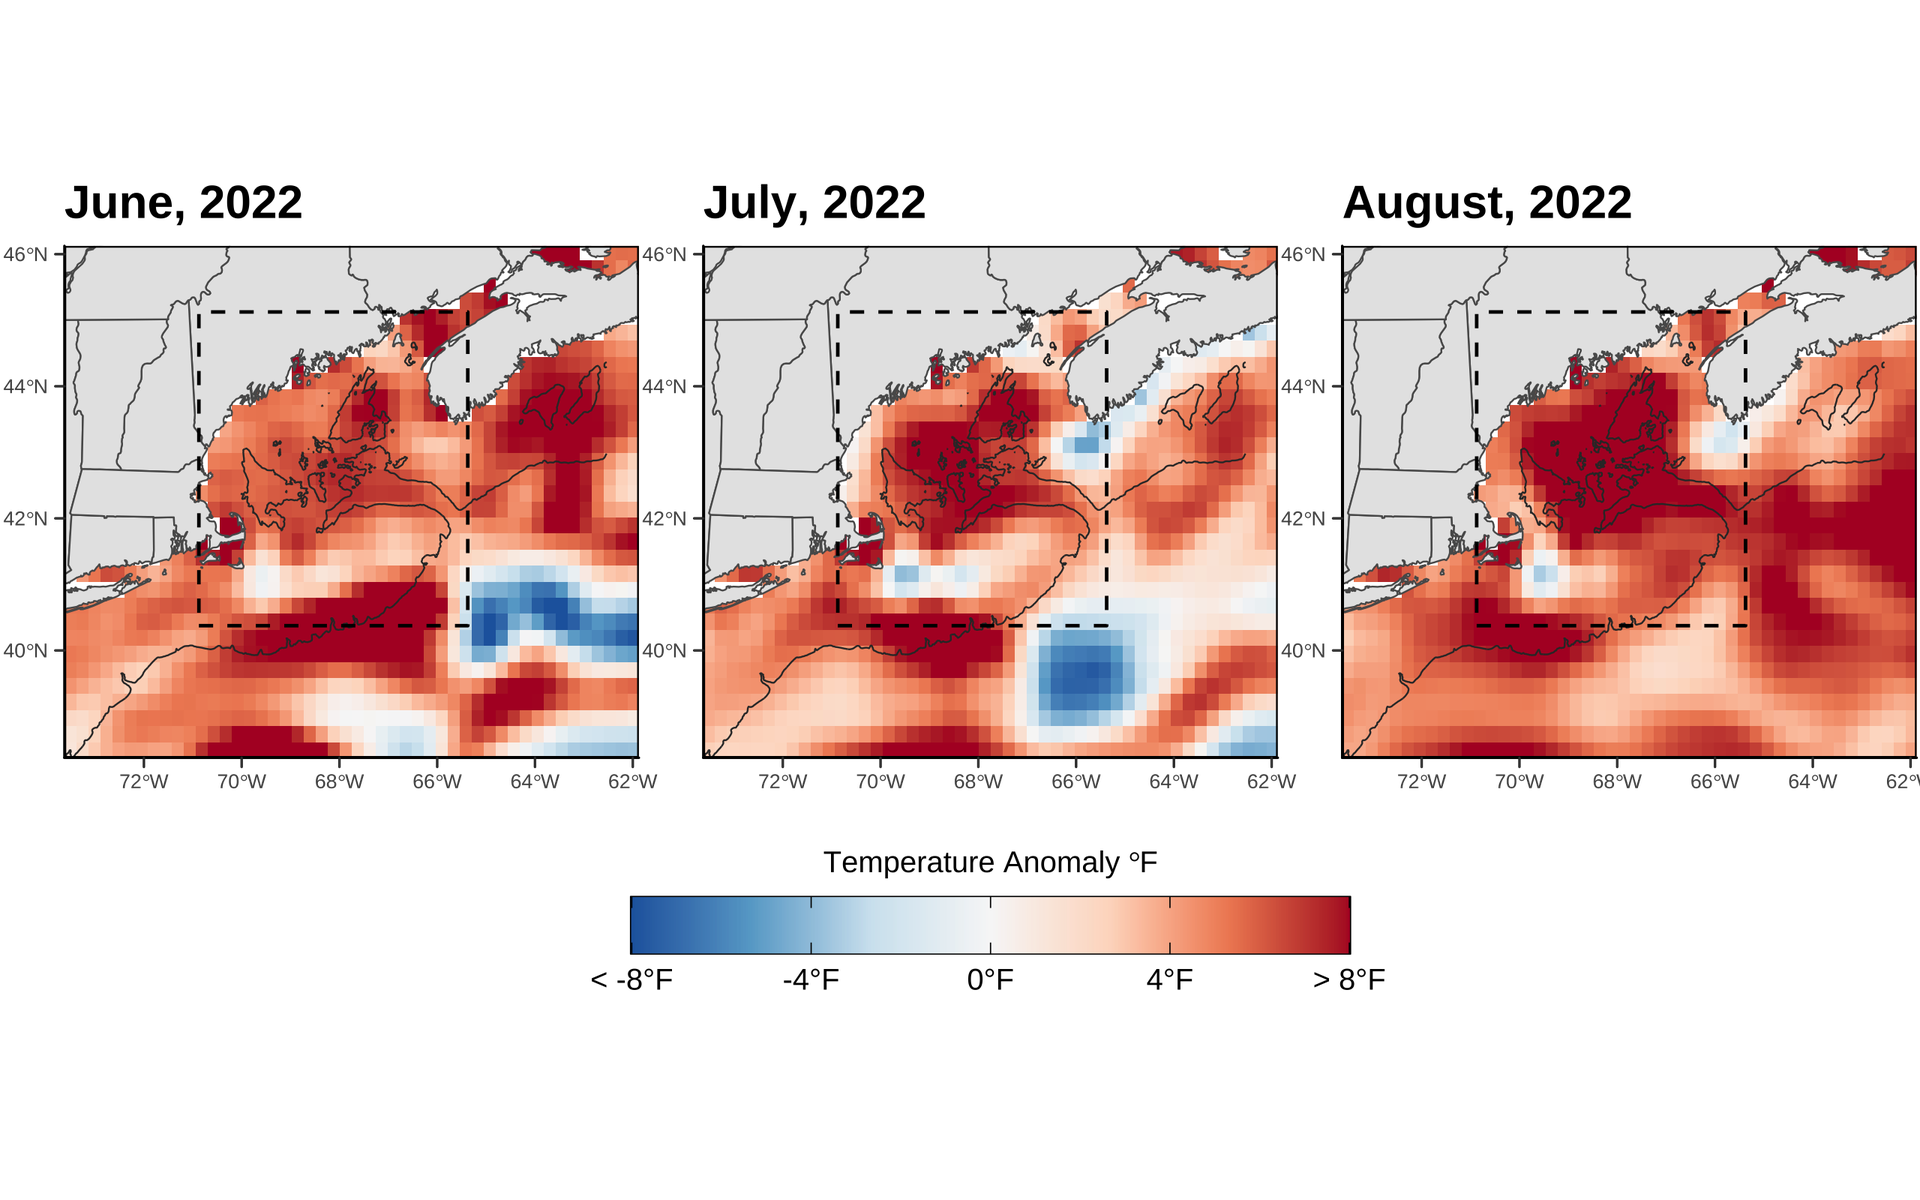
Average monthly temperature anomalies for each grid cell are displayed below (Figure 9). The warmest anomalies were concentrated just south of the domain studied in June, but by July, SST anomalies within the Gulf of Maine were equally hot. Particularly in the latter part of this summer, monthly-averaged SST anomalies in many parts of the Gulf of Maine reached 8°F above normal when compared to the reference period (1982–2011).

Figure 9 . This series of maps shows the average monthly SST temperature anomalies in June, July, and August 2022. The box outlined by the black dashed line denotes the region of study for the analysis. Darker red regions indicate stronger anomalies.


About the Updates:

Over the past decade, scientists at the Gulf of Maine Research Institute have led a body of research that highlights the rapid pace of warming in the Gulf of Maine. To keep you informed, we share seasonal updates about sea surface temperature (SST) conditions in the Gulf of Maine.

Note About the Data: The figures in this report are created using remotely sensed satellite data as part of publicly funded research efforts. We obtained satellite-derived SST data from NOAA’s National Center for Environmental Information (NCEI), with all maps and figures displaying NOAA’s Optimum Interpolation Sea Surface Temperature Data.

Note on Preliminary Data: This dataset has a 2-week latency period, during which values may change due to quality control measures. Any data within 14 days of the publication date may be subject to change.

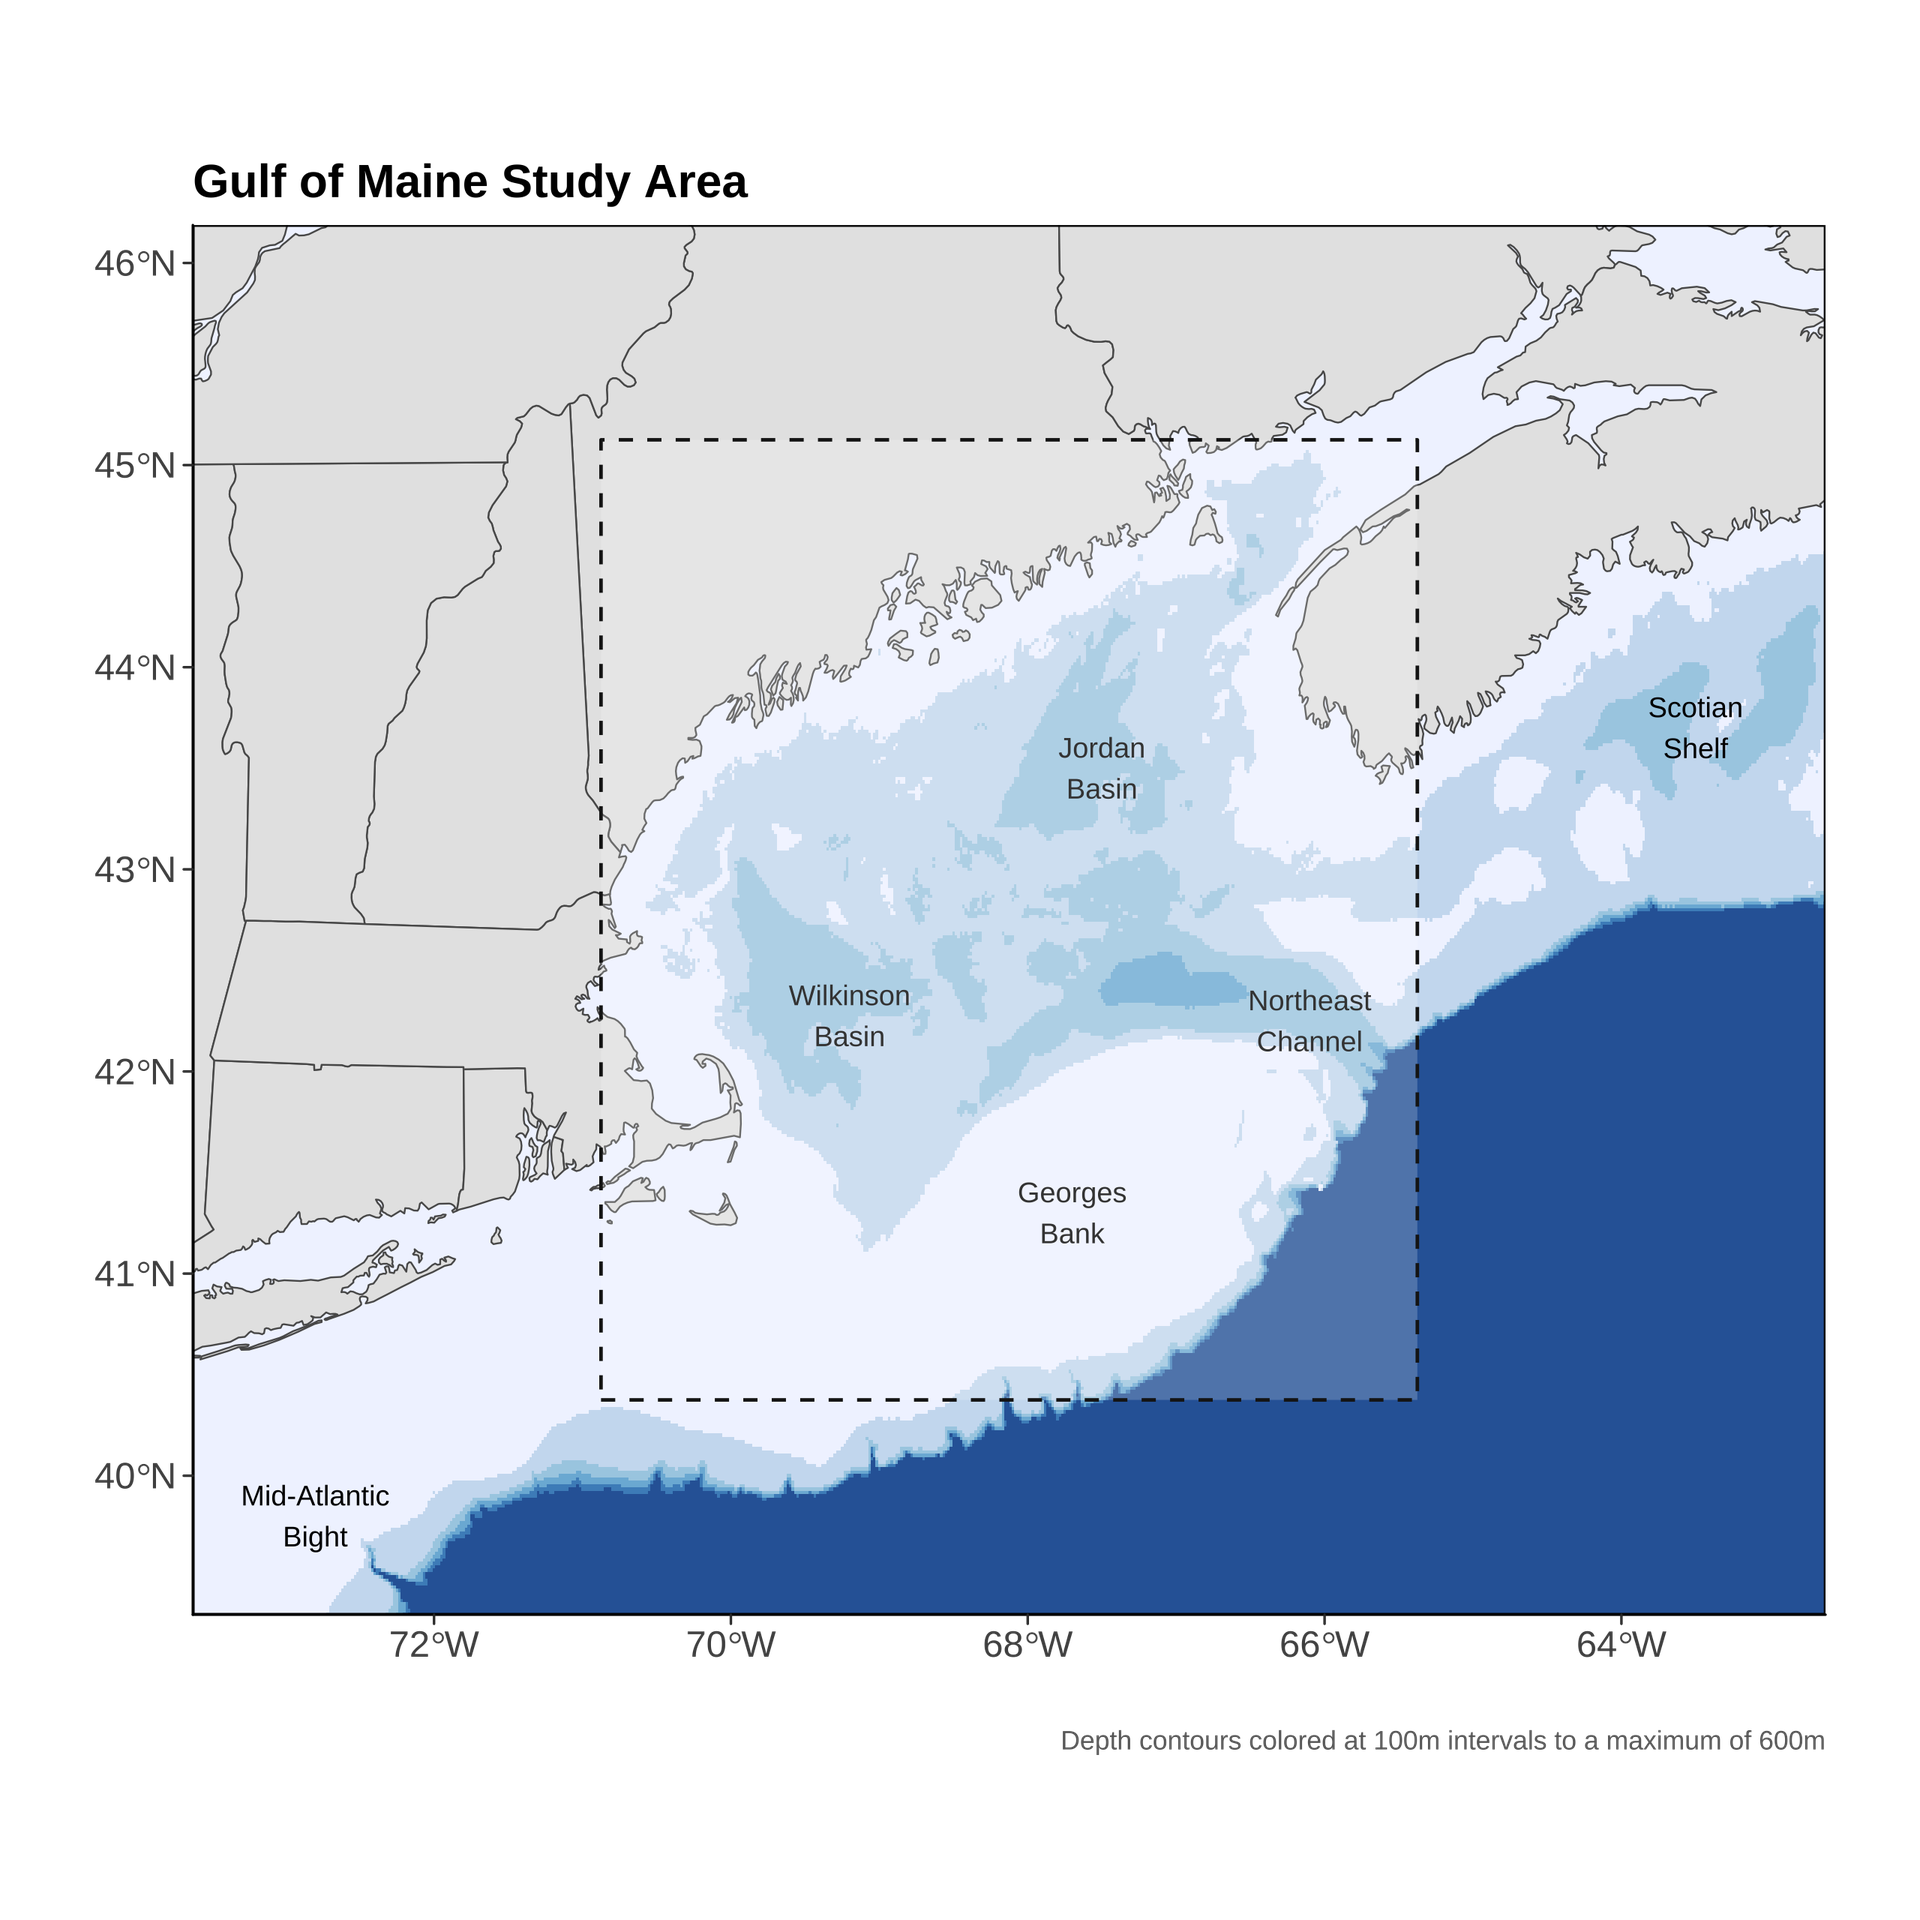
The Gulf of Maine Region

For analyses like these, it is important to be clear about the spatial extent that “defines” the Gulf of Maine (Figure 10), as different borders could produce different results. The spatial domain we use as the “Gulf of Maine” is displayed below. This area is consistent with previous reports and publications GMRI has produced.

Figure 10. A dashed rectangular line marks the spatial domain used for Gulf of Maine SST analyses. Depth contours colored at 100m intervals with all depths greater than 600m shown in dark blue.
Figure 10. Spatial domain used for Gulf of Maine SST analyses. Depth contours colored at 100m intervals with all depths greater than 600m shown in dark blue.

Read More