Gulf of Maine Warming Update: Summer 2023
Announcements | Oct 3, 2023
Over the past decade, scientists have led a body of research that highlights the rapid pace of warming in the Gulf of Maine. To help keep you informed, we share seasonal and annual updates about conditions in the Gulf of Maine.
Read on for an inside look at what we've learned in our summer 2023 Gulf of Maine warming update.

Summer Highlights
For this seasonal report, we present an analysis of SST for summer (June 1, 2023 – August 31, 2023). During this season, the average SST for the Gulf of Maine was 61.01°F, making it the eighth hottest summer on record for the period of 1982 – 2023 — the period over which the satellite data used are available. This seasonal average temperature is 1.91°F above the 1991 – 2020 climatological reference period (CRP) summer average of 59.1°F.
Weekly Temperatures
In Table 1 we highlight how the SST for each week this summer compares to the 1991 – 2020 CRP for the area shown in Figure 10 (see "About the Updates" section). The observed SST, long-term average SST, and SST anomalies (i.e., departures from the long-term average SST) are shown.

Monthly Statistics
Table 2 shows monthly average SST for summer 2023, where we see each month was 1°F or more above the 1991 – 2020 CRP. July showed the largest deviation from the long-term climatological average, with an average SST anomaly of 3.12°F, making it the fourth warmest July on record. In contrast, while June and August still clocked in above the long-term average for those months, they came in at the 9th and 12th warmest on record, respectively.

Seasonal Trends and Anomalies in Context
The Gulf of Maine is an area of particular interest to the scientific community because of the remarkable rate of warming it has experienced over the past several decades, coupled with its importance as a major driver for the regional economy.
When looking at average summer temperatures from the beginning of the satellite record in 1982 (Figure 1), there is a clear long-term increase, with summer SSTs warming at a rate of 1.05°F per decade. This rate is approximately fours times the rate that global ocean summer sea surface temperatures are warming (0.27°F per decade).

The unprecedented levels of warmth over the past decade or so are consistent with what researchers believe has been a distinct regime shift in the major influences on SSTs in the Gulf of Maine. The drivers of this warming (e.g., a potential weakening of the Atlantic Meridional Overturning Circulation, widening of the Gulf Stream, changes in the characteristics of the Labrador Current) have been well-documented in the peer-reviewed literature, including through research by GMRI scientists.
How Does this Summer Compare?
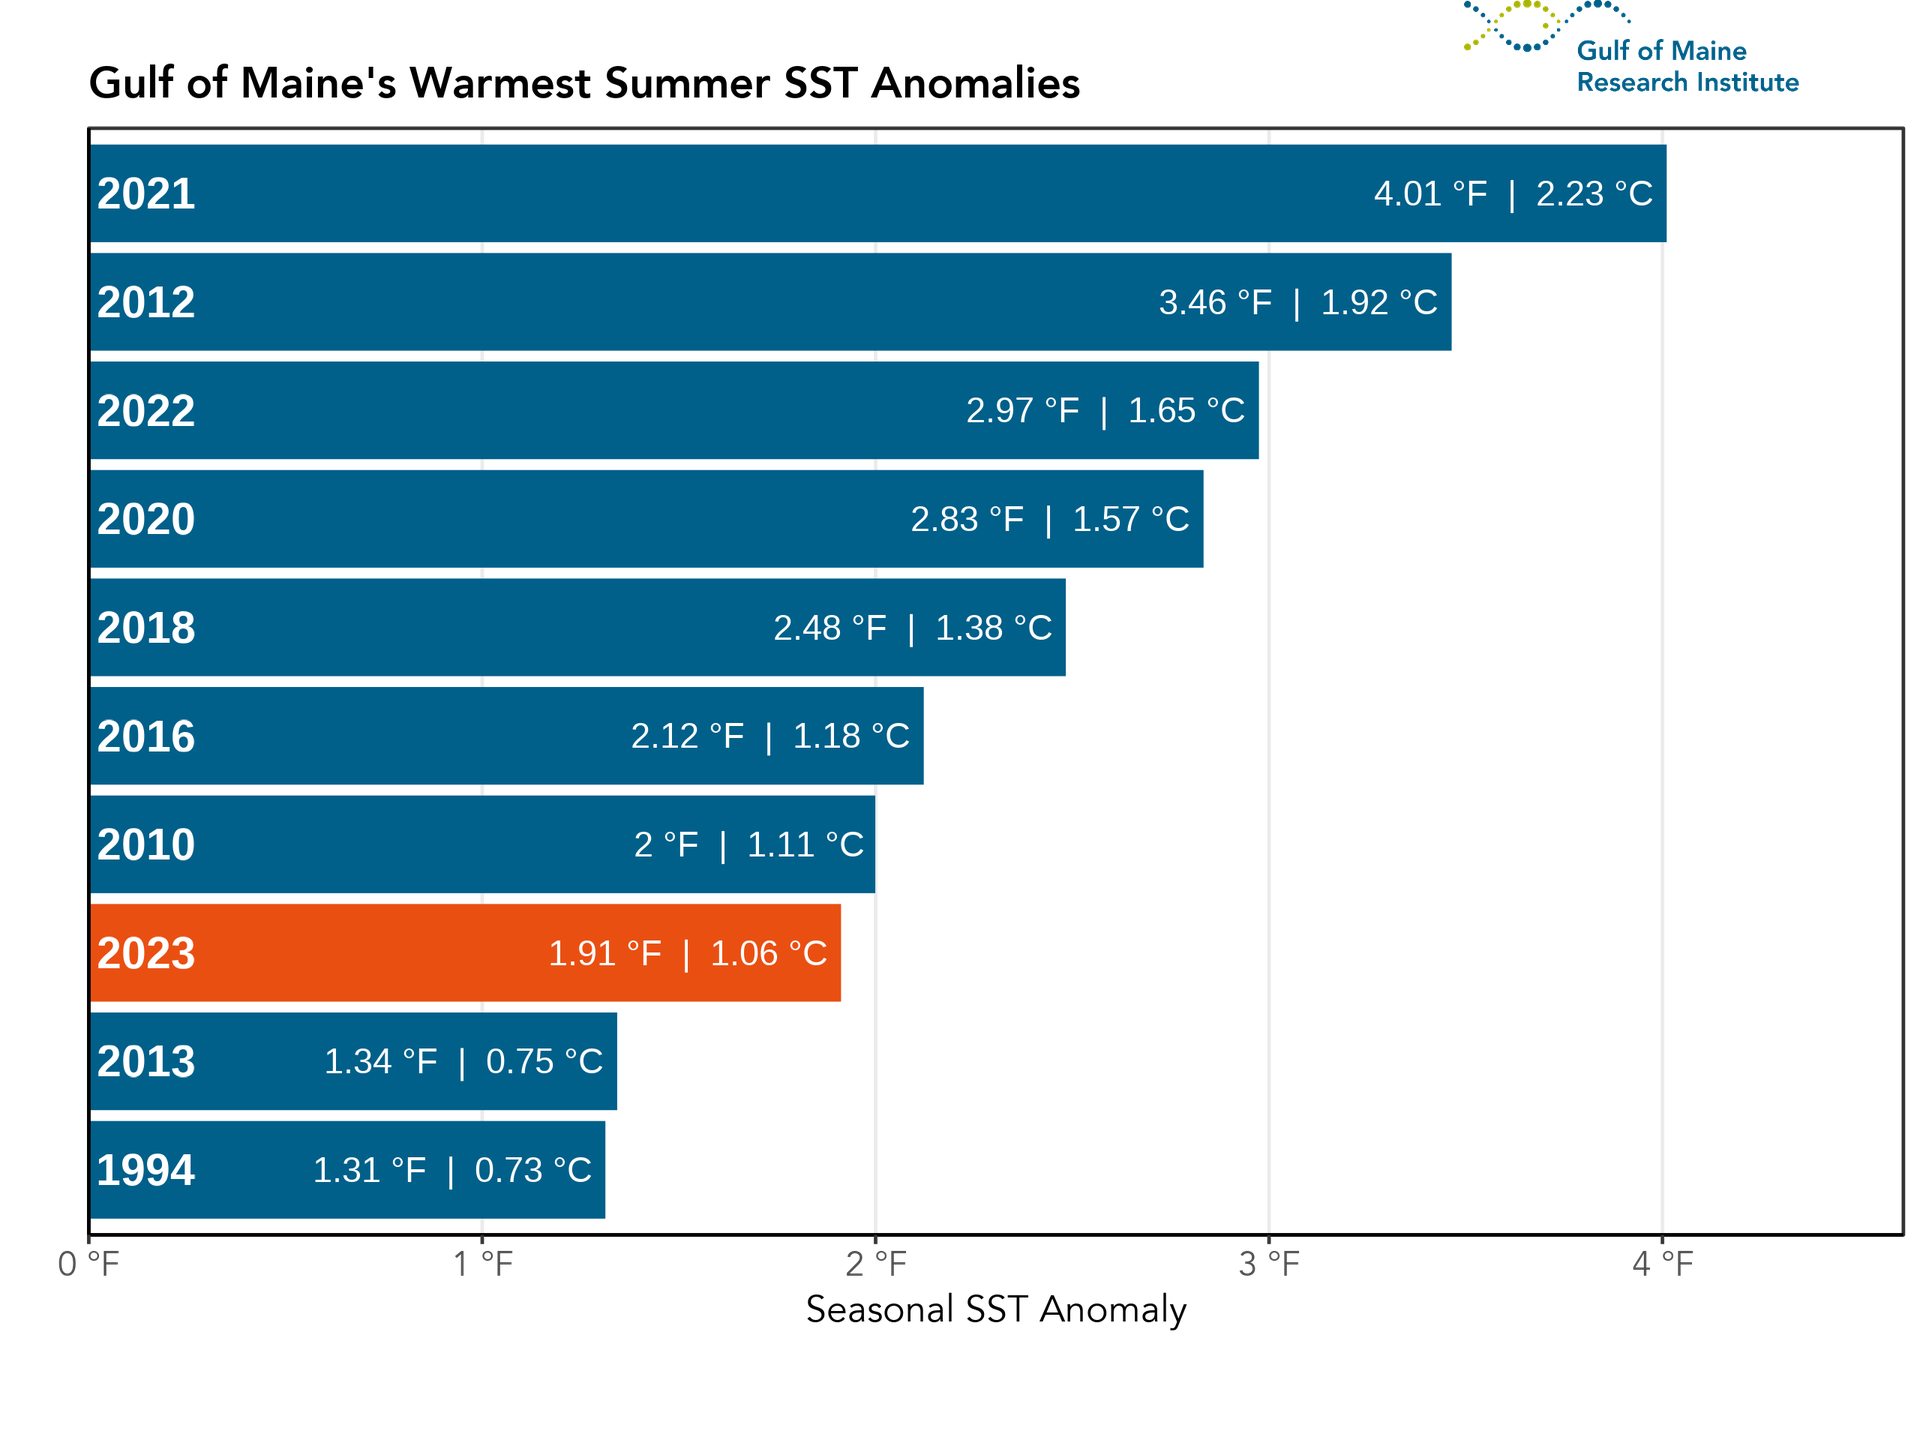
2023 was the eighth warmest summer season observed in the Gulf of Maine during the 41 years we have satellite data to analyze (Figure 2). Each of the top seven warmest summer seasons have all occurred in the last decade.
Marine Heatwave Conditions
The most commonly used definition of a “marine heatwave” (MHW) is when daily average SSTs exceed the 90th percentile of a climatological (i.e., 30-year) average for at least five consecutive days. Gaps of two days or less in this threshold do not constitute a break in the MHW event.
Using this broadly accepted definition, the Gulf of Maine has experienced MHW conditions for 17% of days this summer. Following a May 2023 that was relatively cool compared to the last several years — as reported in our Spring 2023 report — SST values remained only slightly above average up until the middle of July when they breached heatwave status for 16 days. For the first time since summer 2019, SSTs in June fell below the 1991 – 2020 average for several days.

Presenting SST conditions in terms of anomalies (Figure 4) as opposed to absolute values (Figure 3) illustrates in greater detail the magnitude of MHW conditions throughout the summer. The most extreme daily SST anomalies for summer 2023 occurred towards the end of July, with temperatures exceeding 5°F above the climatological average before falling to near 1 – 2°F above the climatological mean for the remainder of the summer.

Heatmap of Temperature Anomalies and Heatwave Events
Looking at the full record of daily SST anomalies in the Gulf of Maine (Figure 5), the distinct thermal regime shift beginning around 2010 is evident. Indeed, since 2012, the Gulf of Maine has experienced far more persistent MHW conditions (indicated by solid black lines) than at any other point in the satellite record, despite much of late spring and early summer 2023 not crossing that threshold.

Conditions in the Gulf of Maine this summer were unusually cool when compared to recent years. Summer SST in the previous three years had been noteworthy for their extended MHW conditions, part of a long-term trend of unseasonably warm summer and fall temperatures since 2012. The relatively mild summer of 2023 stands in stark contrast to the immediately preceding spring season, which was the second warmest on record.
Spatial Distribution of Seasonal Anomalies
From a spatial perspective, the Gulf of Maine and (most) surrounding areas experienced above average SSTs during summer 2023, but the warmest patches were to the south and west of Georges Bank, mostly outside the domain analyzed in preceding sections (Figure 6). The highest seasonally averaged SST anomaly of any location in this broader region was 5.07°F — just outside the southern edge of the domain analyzed.

Monthly Temperature Anomalies
Average monthly SST anomalies are shown in Figure 7. The warmest anomalies were observed in June and July and were largely confined to areas just beyond the region of study (i.e, beyond the continental shelf where the Gulf Stream and Labrador Current have significantly more influence on oceanic conditions). During the month of June, the Gulf of Maine was located just north of two water masses that created a sharp contrast between above average SST to the south and below average SST to the east. By June this sharp contrast had diffused, leaving a more consistent — and anomalously warm — thermal landscape in the region. During August there were larger areas overall of below-average temperatures, primarily to the east of Georges Bank.

Extraordinarily Hot North Atlantic Summer
2023 has been a year with headline temperatures for the North Atlantic region (extending from the equator to 60°N) — reaching truly exceptional temperatures this summer (Figure 8).

The extraordinarily warm waters of the eastern Atlantic have garnered much attention this summer. They have contributed to sweltering temperatures on land. Across the Atlantic, SSTs over the Grand Banks shattered records (Figure 9). The smattering of cool and warm anomalies extending from Cape Hatteras, NC northeastward beyond the Grand Banks is illustrative of the large interannual variability and smaller-scale ocean mixing associated with the Gulf Stream.

About the Updates
The Gulf of Maine Region
For analyses like these, it is important to be clear about the spatial extent that “defines” the Gulf of Maine (Figure 10), as different borders could produce different results. The spatial domain we use as the “Gulf of Maine'' is displayed below. This area is consistent with previous seasonal and annual Gulf of Maine warming reports produced by GMRI.

A Note on Data Sources
NOAA_ERSST_V5 data provided by the NOAA/OAR/ESRL PSL, Boulder, Colorado, USA.
NOAA High Resolution SST data provided by the NOAA/OAR/ESRL PSL, Boulder, Colorado, USA.
The figures in this report are created using remotely-sensed satellite data as part of publicly funded research efforts. Satellite sea surface temperature (SST) data was obtained from NOAA’s National Center for Environmental Information (NCEI), with all maps and figures displaying NOAA’s Optimum Interpolation Sea Surface Temperature Data.
Citing This Work
If you would like to cite this report, please use:
Gulf of Maine Research Institute. 2023. Gulf of Maine Warming Update: Summer 2023 www.gmri.org/stories/gulf-of-maine-warming-update-summer-2023.