2020 Gulf of Maine Warming Update
Perspectives | Aug 13, 2020
by Andrew Pershing, Ph.D.
Adjunct Scientist & Former Chief Scientific Officer
Each summer, we share an update about conditions in the Gulf of Maine. Over the past decade, scientists have led a body of research that highlights the rapid pace of warming in the Gulf of Maine.
Read on for an inside look at former CSO Dr. Andrew Pershing's observations from the summer of 2020.

Well, 2020 has been a weird year, with a lot of changes for all of us. Amid so much uncertainty, many of us are looking for comfort in the few things that haven’t changed. For me, it’s stars at night, birds on the feeder, and heatwaves in the Gulf of Maine.
Sure, the last point is not exactly good news, but marine heatwaves have become the norm in the Gulf of Maine over the last decade.
Marine heatwaves are defined as five or more consecutive heatwave days. To qualify as a heatwave day, the temperature for that day must be higher than 90% of the same calendar days during the 30-year baseline period (1982-2011). Since 2010, every year has had at least 81 days that met this threshold.

In Figure 1, above, each row is a year and the color indicates whether the day is above (red) or below (blue) the average. Black dots indicate heatwaves. Last year was actually the coolest year in the last decade, but 2019 still managed to have 81 heatwave days. A few of those days were in August, but most were in the fall, which has become a typical pattern for us.
This year, we have already had 102 heatwave days. The year started out warm (for winter); we had a 52-day-long winter heatwave from January 14–March 6. During this period, the Gulf of Maine set several record temperatures (dark red circles in Figure 2, below). Conditions moderated in the spring and were even below normal for a few days in May — something we haven't seen often this decade.
Beginning in mid-June, temperatures in the Gulf of Maine began rising rapidly. It took only four days to go from normal to heatwave levels. Five days later, we were experiencing record temperatures. Overall, it was the fastest nine-day temperature change in the satellite period. By the end of July, we were experiencing record temperatures. Although the August data is still preliminary (the satellite data from NOAA takes about two weeks to become official), the heatwave is still underway. We are likely close to or above record levels as we approach the peak of our annual temperature.


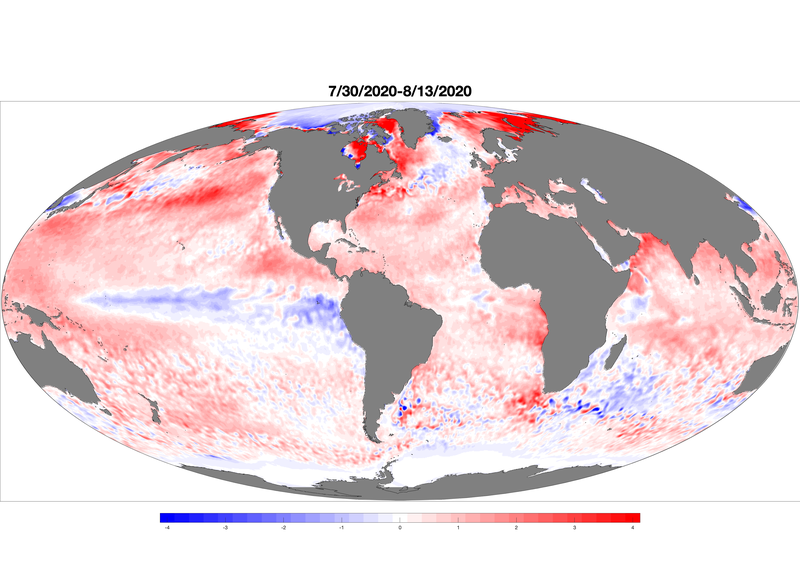
This year’s heatwave has been most intense in the western Gulf of Maine and Massachusetts Bay (Figure 3). At the same time, the waters near the Maine-Canada border have been cooler — even a bit below average at times. While the Gulf of Maine is likely experiencing the most anomalously warm temperatures of any part of the US coast, warming in the Arctic is in some ways even more alarming (Figure 4). The Barents and Kara Seas north of Norway and Russia are unusually warm, and sea ice coverage in the Arctic is extremely low.
In some ways, the most remarkable thing about this year’s heatwave is how ordinary it seems. Since 2010, the temperature in the Gulf of Maine has been above average 92% of the time. It’s been at heatwave levels for 55% of the time. Whether it’s the temperatures alone, or some of the species that come with them (e.g. recent reports of black sea bass and bonito), observations that would have surprised us a decade ago now feel expected. Like so many other parts of our lives this year, what used to be unimaginable is now a new normal.


