Gulf of Maine Warming Update: Fall 2023
Reports | Jan 8, 2024
Over the past decade, scientists have led a body of research that highlights the rapid pace of warming in the Gulf of Maine. To help keep you informed, we share seasonal and annual updates about conditions in the Gulf of Maine.
Read on for an inside look at what we've learned in our fall 2023 Gulf of Maine warming update.

Fall 2023 Highlights
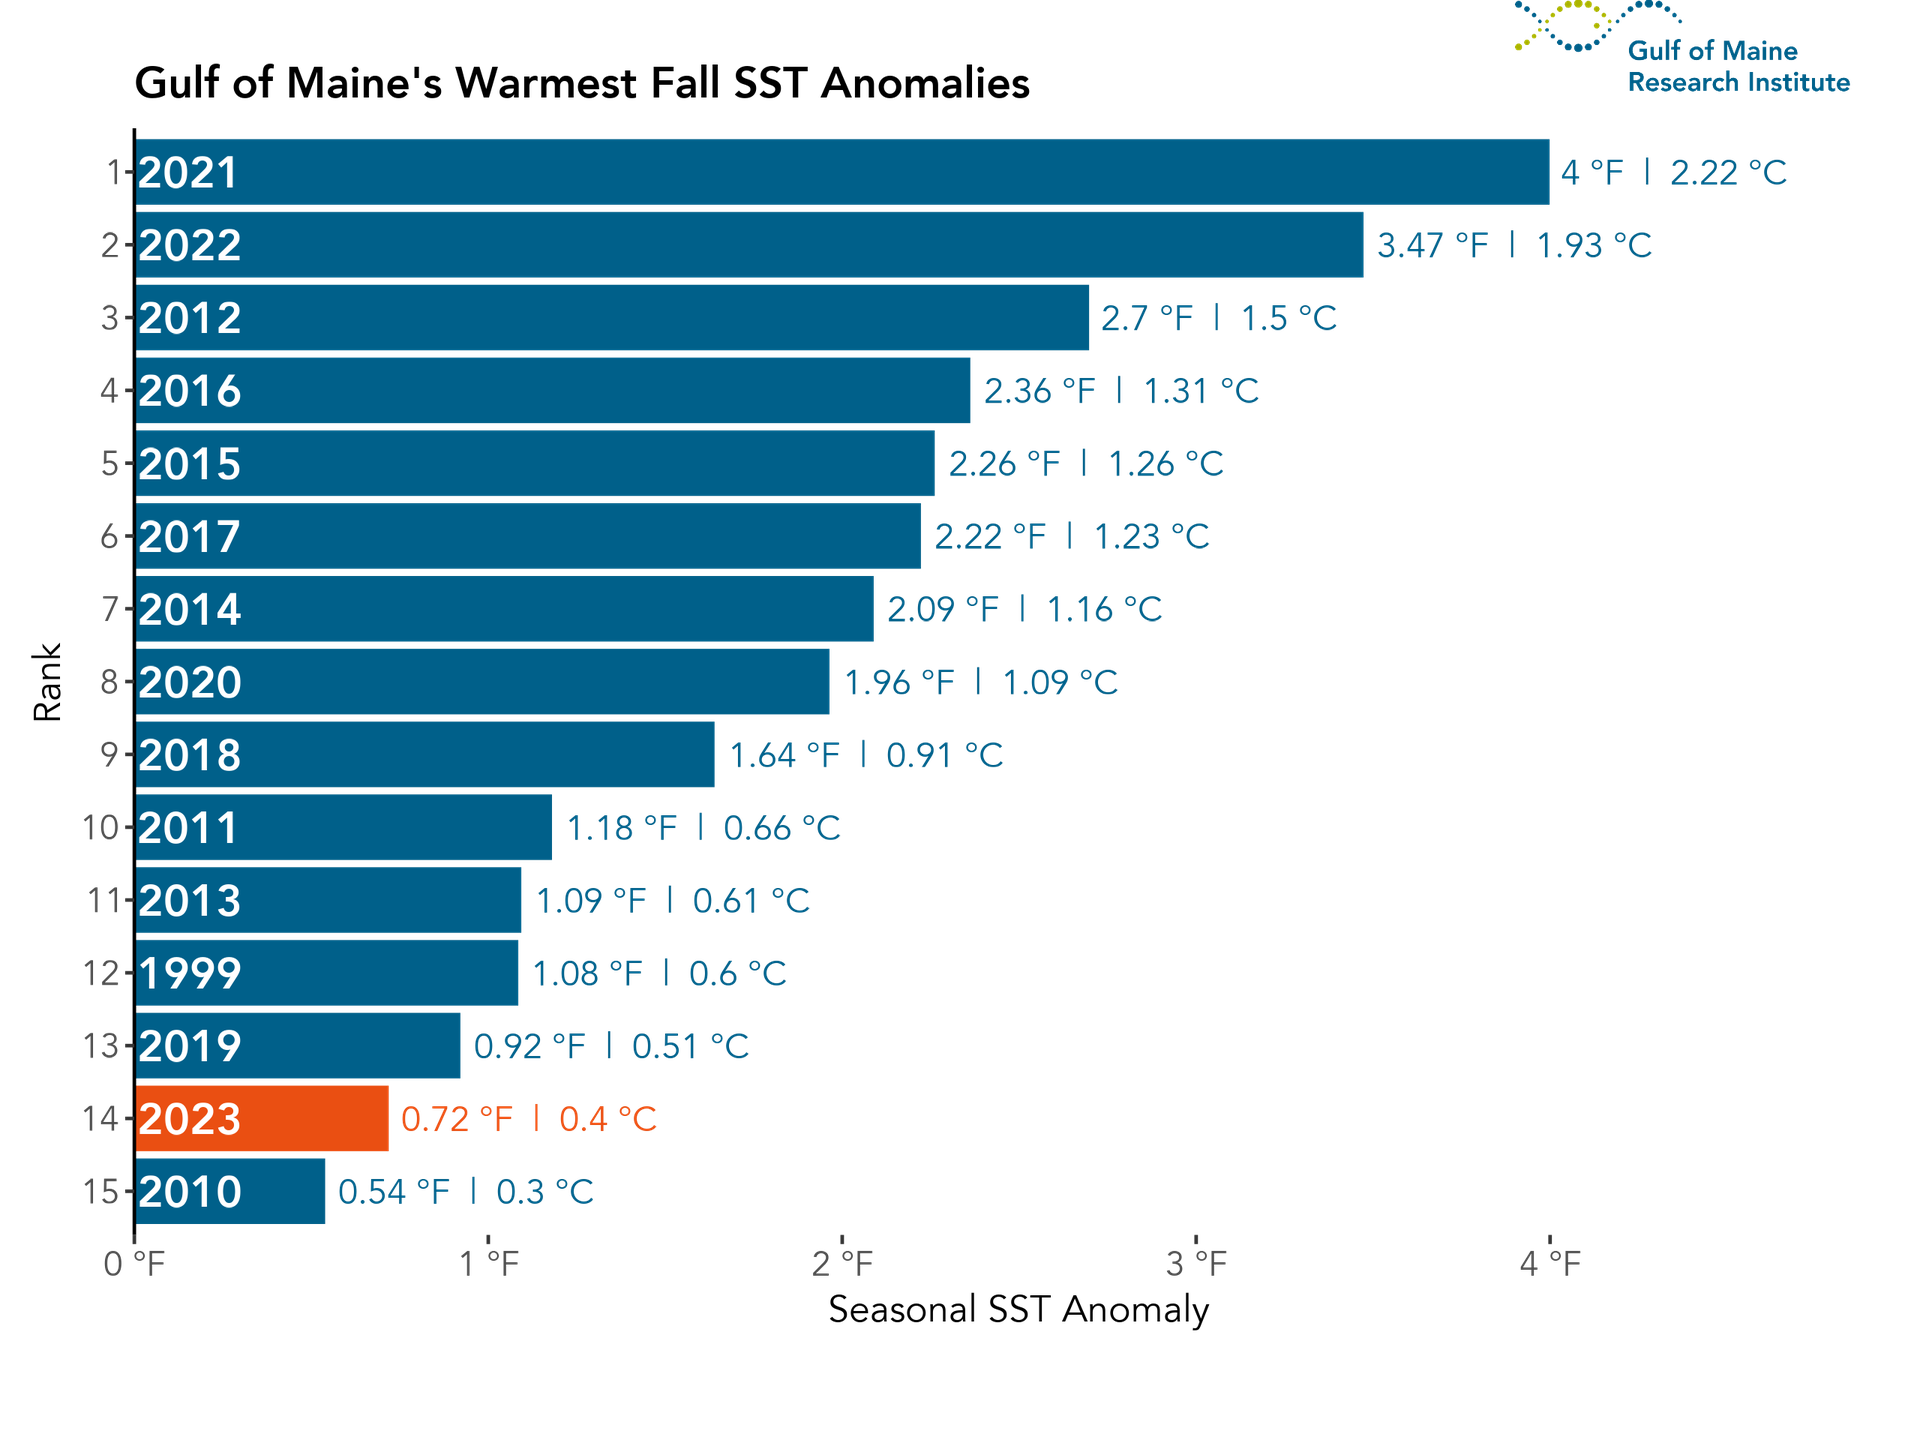
For this seasonal report we present an analysis of sea surface temperature (SST) for fall (September 1, 2023 – November 30) 2023. This is the time of year when SST in the Gulf of Maine begins to decrease as the region transitions into more wintery conditions. This year, the average fall SST for the Gulf of Maine was 57.25°F, making it the 14th hottest fall on record for the period of 1982 – 2023 — the period over which the satellite data used are available. This seasonal average temperature is 0.72°F above the 1991 – 2020 climatological reference period (CRP) fall average of 56.53°F.
Weekly Temperatures
Table 1 highlights how the SST for each week this fall compares to fall seasons over the 1991 – 2020 CRP for the area defined in Figure 8. The observed SST, long-term average SST, and SST anomalies (i.e., departures from the long-term average SST) are shown. Fall SST was on average 0.72°F above normal, with weekly average anomalies ranging from -1.5°F to +3.1°F.

Monthly Statistics
Table 2 shows monthly average SST for fall 2023. Each month was within ~1.1°F of the 1991 – 2020 CRP. October showed the largest deviation from the long-term climatological average, with an average SST anomaly of +1.1°F, making it the 12th warmest October on record. September and November were cooler at 0.6 and 0.5°F above the long-term average — coming in as the 14th and 16th warmest September and November on record, respectively.

How Does Fall 2023 Compare to the Past?
2023 was the 14th warmest fall season observed in the Gulf of Maine during the 41 years we have satellite data to analyze, a departure from fall seasons in recent years, which experienced well-above average SSTs (Figure 1).
Seasonal Trends and Long-Term Global Context
The Gulf of Maine is an area of particular interest to the scientific community because of the remarkable rate of warming it has experienced in recent years, coupled with its importance as a major driver for the regional economy.
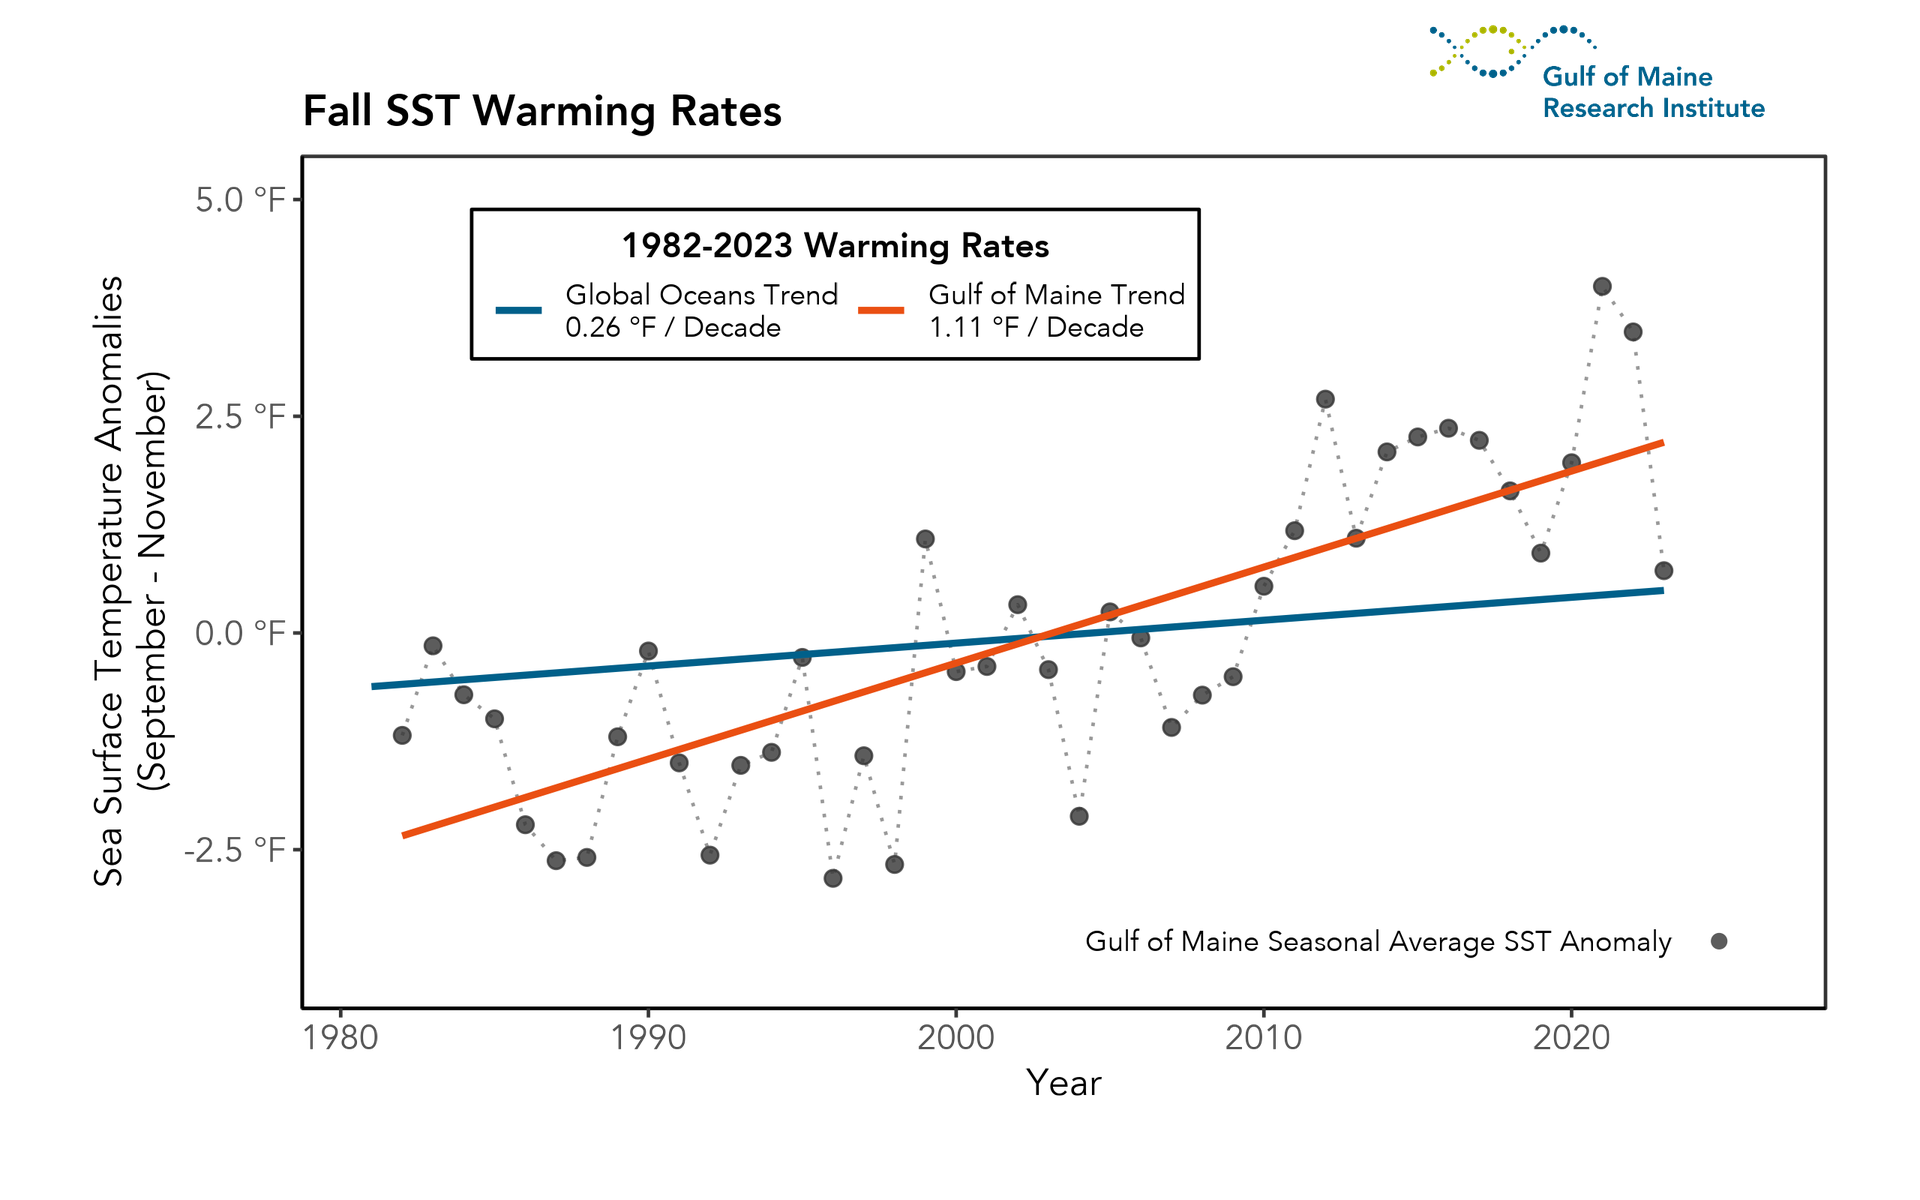
Figure 2 illustrates the average fall temperature anomaly for each year in the Gulf of Maine since the beginning of the satellite record in 1982, overlaid with long-term SST anomaly trends for the Gulf of Maine (orange) and global oceans (blue).The fall rate of warming for the Gulf of Maine (1.11°F per decade) is roughly 4x faster than the warming rate for oceans globally (0.26°F per decade). The fall SST anomaly for the Gulf of Maine in 2023 was 2.8°F cooler than that from 2022, the largest year-over-year decline in fall temperatures in the satellite record. Despite the sizable year-over-year change, fall 2023 remained warmer than 28 of the 29 fall seasons prior to 2010, consistent with the observed long-term warming trend in the region.
The unprecedented levels of warmth over the past decade or so are consistent with what researchers believe has been a distinct shift in the major influences on SSTs in the Gulf of Maine. The drivers of this warming (e.g., a potential weakening of the Atlantic Meridional Overturning Circulation, widening of the Gulf Stream, changes in the characteristics of the Labrador Current) have been well-documented in the peer-reviewed literature, including through research by GMRI scientists.
Observed SSTs are also influenced by atmospheric weather patterns which can act to amplify warming or cooling of surface waters. Sustained periods of low cloud cover and the consequent direct sunlight can rapidly warm the ocean at the surface. Steady winds can act as a fan, advecting heat away from the ocean and cooling the surface. Strong winds and storm systems may also lower SST through mixing, which can bring cooler water from depth closer to the surface.
Marine Heatwave Conditions
The most commonly used definition of a “marine heatwave” (MHW) is when daily average SSTs exceed the 90th percentile of a climatological (i.e., 30-year) average for at least five consecutive days. Gaps of two days or less in this threshold do not constitute a break in the MHW event.
Using this broadly accepted definition, the Gulf of Maine experienced MHW conditions for 7% of days this fall. September was the only month this fall when SSTs remained above the threshold of a MHW, ultimately exhibiting these anomalously warm conditions for a total of six days. SSTs for the remainder of the season remained closer to the long-term average, even dipping below that climatological average for almost three weeks from late September into early October.

Presenting SST conditions in terms of anomalies (Figure 4) as opposed to absolute values (Figure 3) illustrates in greater detail the magnitude of MHW conditions throughout the fall season. The highest daily SST anomalies for fall 2023 occurred in early September, with temperatures building to over 3°F above the climatological average. SST anomalies rapidly dropped shortly after to levels closer to the long-term climatological average, and remained low for the rest of the season.
The abrupt drop in SST anomalies recorded in September was a direct result of extratropical storm Lee’s traversal through the region. This storm system crossed over Georges Bank from the South on September 16, before continuing North towards the Bay of Fundy, bringing with it sustained winds and heavy precipitation. During its traversal across the eastern Gulf of Maine, SST anomalies fell more than 5°F over a period of 12 days, demonstrating how atmospheric conditions can alter surface conditions in the ocean. Similar storm crossings have occurred in the recent past, including in 2019 when Hurricane Dorian passed through the Gulf of Maine after working its way up the US East Coast. Both years had the fewest fall heatwave days seen in the past two decades (2019: 0 days, 2023: 6 days).

Heatmap of Temperature Anomalies and Heatwave Events
Looking at the full record of daily SST anomalies in the Gulf of Maine (Figure 5), the distinct thermal regime shift beginning around 2010 is evident. Indeed, since 2012, the Gulf of Maine has experienced far more persistent MHW conditions (indicated by solid black lines) than at any other point in the satellite record.

SST anomalies in the Gulf of Maine this fall were lower than in any season since mid-2019. Fall SSTs in the previous three years had been noteworthy for their extended MHW conditions, part of the long-term trend of unseasonably warm falls since 2012 (Figure 1). The relatively mild fall in the Gulf of Maine this year is a contrast to the 2023 spring and summer seasons — which were the 2nd & 8th warmest on record.
Spatial Distribution of Seasonal Anomalies
Figure 6 illustrates the spatial variability in SST anomalies throughout the Gulf of Maine for fall 2023. In general, conditions were relatively mild, exhibiting seasonally-averaged SST anomalies that did not deviate beyond +/- 3°F from the long-term average. There was an east-to-west gradient in seasonally averaged SST anomalies within the Gulf of Maine, potentially representing the influence of the anomalously cool surface water (depicted by the deep blues in Figure 6) entering the study region through the Northeast Channel. The highest seasonally averaged SST anomaly in the Gulf of Maine was 3.05°F — located near Penobscot Bay.

Monthly Temperature Anomalies
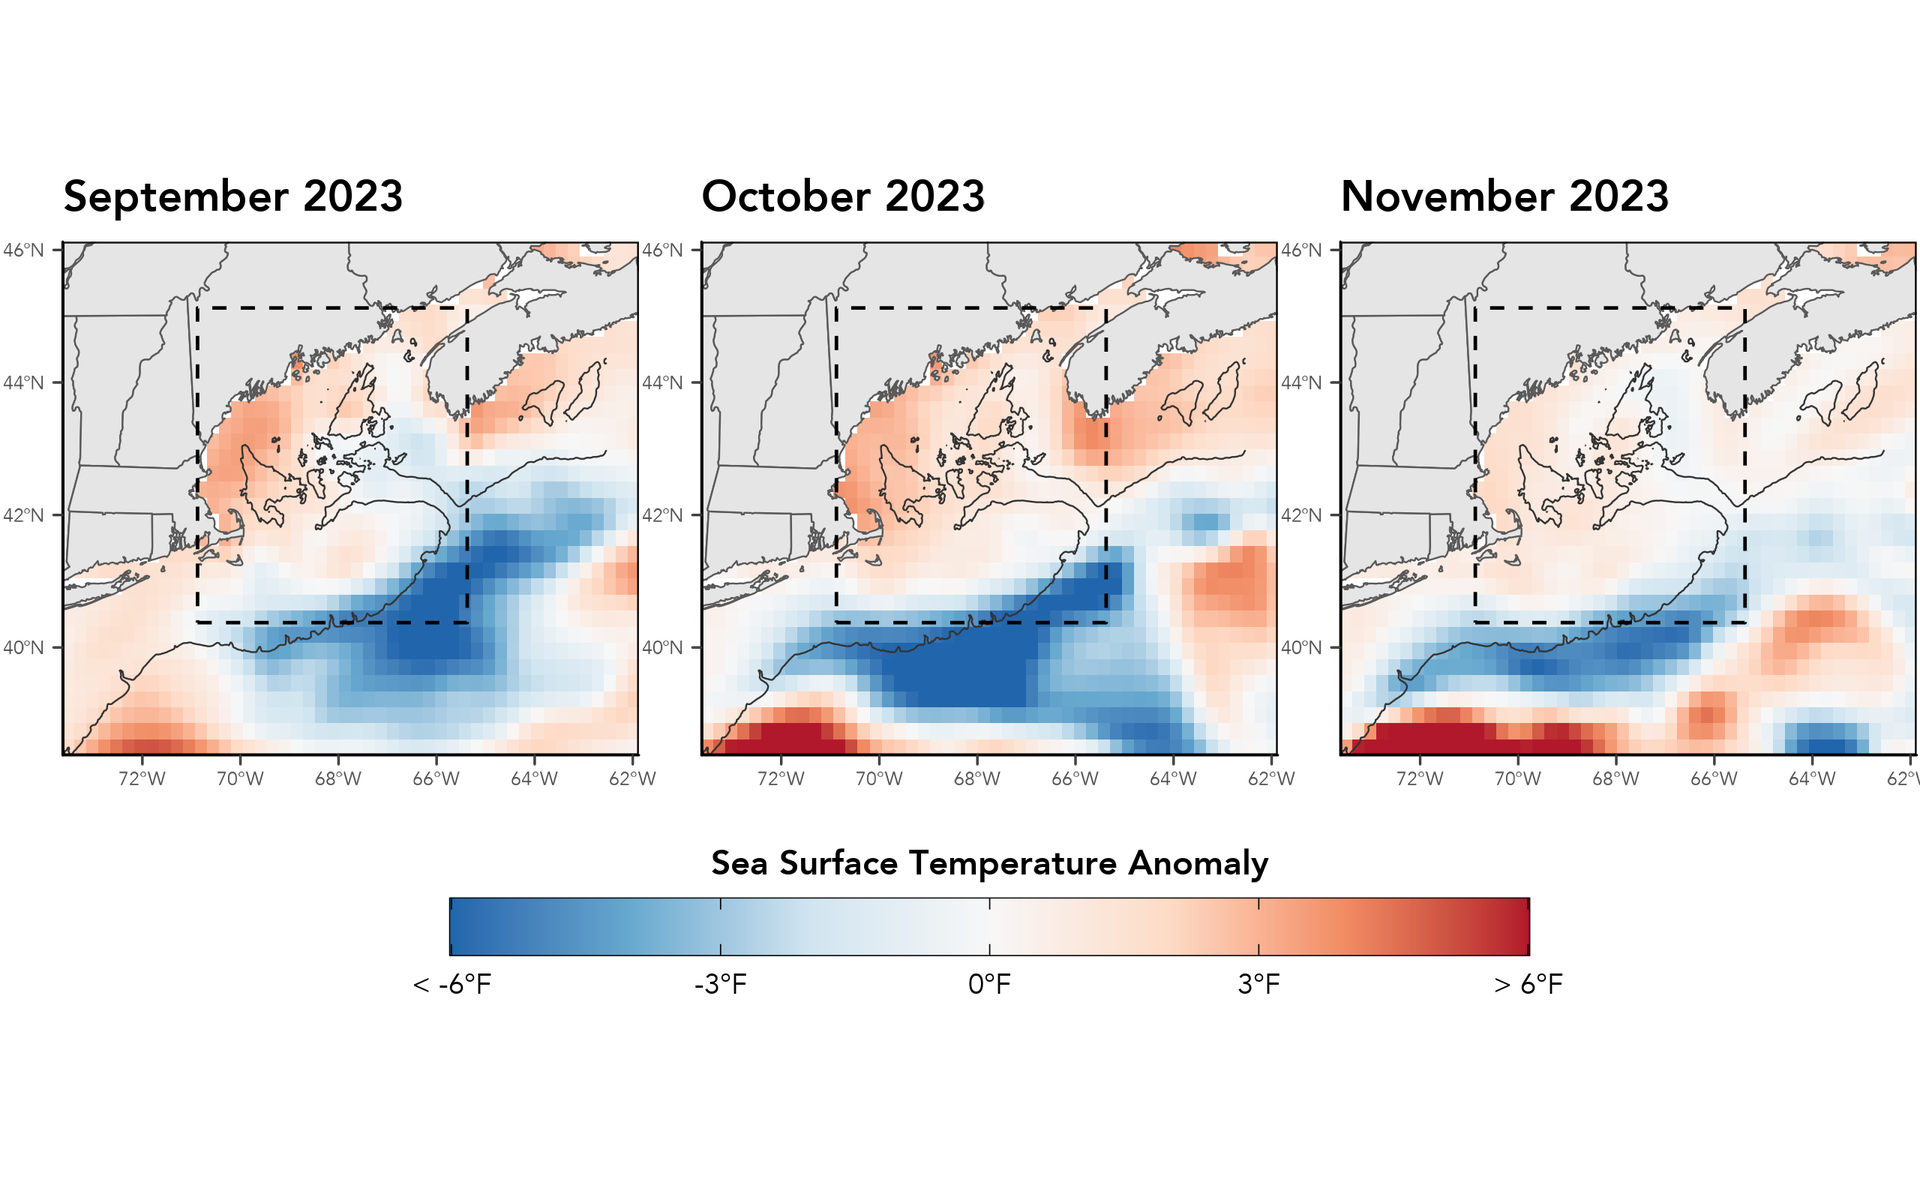
The spatial distribution of average monthly SST anomalies throughout the Gulf of Maine are shown in Figure 7. During the month of September, above-average SSTs in the Gulf of Maine were concentrated along the shallower coastal areas to the west. Colder than average temperatures were present near the Northeast Channel to the east, where the waters are deeper. In October the pattern persisted, but with fewer below-average temperatures in the Northeast Channel area. By November, cooler anomalies were again present near the Northeast Channel as well as to the north towards the Bay of Fundy. Across all months, a large area of colder than average SST anomalies was present to the southeast of the Gulf of Maine. This area of colder water exhibited the coldest SST anomalies during October. The cold patch appeared to move westward over the course of the fall season, along the edge of the continental shelf.
About the Updates
The Gulf of Maine Region
For analyses like these, it is important to be clear about the spatial extent that “defines” the Gulf of Maine (Figure 8), as different borders could produce different results. The spatial domain we use as the “Gulf of Maine'' is displayed below. This area is consistent with previous seasonal and annual Gulf of Maine warming reports produced by GMRI.

Note About the Data: The figures in this report are created using remotely-sensed satellite data as part of publicly funded research efforts. Satellite sea surface temperature (SST) data was obtained from NOAA’s National Center for Environmental Information (NCEI), with all maps and figures displaying NOAA’s Optimum Interpolation Sea Surface Temperature Data.
Citing This Work
If you would like to cite this report, please use:
Gulf of Maine Research Institute. 2023. Gulf of Maine Warming Update: Fall 2023 https://gmri.org/stories/gulf-of-maine-warming-update-fall-2023/.


